
Journal of Gastroenterology Research and Practice
Research Article - Open Access, Volume 4
Identifying DLAT as a novel therapy target based on integration analysis of the cuproptosis regulatory genes for hepatocellular carcinoma
Xiaowen Guan1*; Zhentao Liu1; Jianwei Wang2; Wei Yang1
1School of Life Sciences, Zhengzhou University, Zhengzhou 45001, China.
2School of Computer and Artificial Intelligence, Zhengzhou University, Zhengzhou 45001, China.
*Corresponding Author : Xiaowen Guan
School of Life Sciences, Zhengzhou University, Zhengzhou 45001, China.
Email: guanxiaowen@zzu.edu.cn
Received : Mar 05, 2024
Accepted : Apr 11, 2024
Published : Apr 18, 2024
Archived : www.jjgastro.com
Copyright : © Guan X (2024).
Abstract
Cuproptosis is a newly found Regulated Cell Death (RCD) form, dependent on copper and mitochondrial respiration. However, limited available researches of the roles of cuproptosis regulators in prognosis and development of Hepatocellular Carcinoma (HCC) prompted us to conduct this investigation. In our study, we systematically analyzed the expression levels and prognostic profiles of 27 cuproptosis regulatory genes in HCC samples downloaded from The Cancer Genome Atlas (TCGA) cohort and developed a prognostic risk model based on 7 genes (NDUFA1, NDUFB2,DLD, DLAT, MTF1, ATP7B, GCSH) by performing step AIC method and multivariate cox regression analysis. The independent prognostic values of the risk score were also validated in the external International Cancer Genome Consortium (ICGC) cohort. Moreover, the Overall Survival (OS) of HCC patients in the low-risk group was significantly longer than that in the high-risk group. Notably, the expression level of DLAT was found to be higher in the HCC tissues compared with normal tissues and high DLAT expression correlated with a poor prognosis. The function of DLAT was further validated in vitro using siRNA tool, DLAT depletion inhibited the proliferation and migration of HCC cells which indicated that DLAT was a potential and promising therapeutic target for HCC.
Keywords: Hepatocellular carcinoma; Cuproptosis; Prognostic risk model; DLAT; Therapeutic target.
Citation: Guan X, Liu Z, Wang J, Yang W. Identifying DLAT as a novel therapy target based on integration analysis of the cuproptosis regulatory genes for hepatocellular carcinoma. J Gastroenterol Res Pract. 2024; 4(3): 1192.
Introduction
Liver cancer is the fourth overall most common cause of cancer-related death worldwide, and its incidence is steadily increasing. The main pathological type of liver cancer is Hepatocellular Carcinoma (HCC) [1]. At present, the treatment methods for patients with HCC include radical resection, radiofrequency ablation, liver transplantation, hepatectomy, Transcatheter Arterial Chemoembolization (TACE) [2,3]. Due to the fact that most patients with HCC are diagnosed till intermediate or advanced stage when many curative approaches are not feasible, resulting in a very low 5-year survival rate less than one in five [4]. Hence, reliable novel prognostic models of HCC are urgently required to make targeted therapies more feasible.
As is known to all, copper is an important and essential trace element for various biological processes, such as energy conversion, oxygen transport, and regulation of oxidative metabolism [5]. Elevated copper concentrations have been reported in many cancers, such as breast [6], lung [7], prostate [8] and gallbladder cancers [9]. Lacked copper concentrations will also showed strong influence for the biological processes and the function of copper-binding enzymes [10], The most severe case of copper deficiency is Menkes disease, which is caused by inadequate transport of copper from enterocytes into the blood due to mutations in the ATP7A gene [11]. While copper accumulation will be toxic and induce death in cells, which namely copper-induced cell death called cuproptosis [12]. Cuproptosis is a totally newly found Regulated Cell Death (RCD) form, distinct from known death mechanisms like apoptosis, autophagy, pyroptosis, necrosis and dependent on copper and mitochondrial respiration [13]. Cuproptosis has been proven that copper binds to the lipoylated components of the Tricarboxylic Acid (TCA) cycle, leading to proteotoxic stress and ultimately cell death. Mitochondria respiration plays an essential role in the process of cuproptosis and mitochondrial is central organelles that provide energy via the process of Oxidative Phosphorylation (OXPHOS), which produces Adenosine Triphosphate (ATP), the main cellular energy currency [14].
Recently, mounting evidence has revealed that signatures based on RCD forms showed substantial predictive values in prognostic, tumor microenvironment, and immunotherapy response prediction for HCC patients [15-17]. Additionally, the study by Zhang et al. showed that serum copper and ceruloplasmin levels may be used as markers for detection of HCC [18]; Guan et al. showed that disrupted Cu-Fe balance in HCC cells would enhance ferroptosis and radiosensitivity [19]. These lines of evidence show the role of RCD forms and copper in HCC development, which indicate that cuproptosis might be closely associated with HCC progression, providing promising filed to finding novel therapies for the treatment of HCC. However, Limited available researches have reported the roles of Cuproptosis Regulatory Genes (CRGs) in prognosis of cancers, this lack of information prompted us to conduct this investigation. Therefore, a comprehensive study regarding the expression, prognosis, diagnosis, immune correlation and mechanism of the CRGs in HCC is urgent.
CRGs reported in literatures were collected in the current studies [13,20], the 27 CRGs we selected were closely related to metabolism and mitochondria respiration. We systematically analyzed their expression levels and prognostic profiles in HCC samples downloaded from TCGA cohort and developed a prognostic risk model based on 7 CRGs by performing step AIC method, and the independent prognostic values of the risk score were validated in external ICGC cohort. Moreover, the Overall Survival (OS) of HCC patients in the high-risk group were significantly shorter than that in the low-risk group showing in the Kaplan-Meier curve plot. Notably, the expression level of DLAT was found to be higher in the HCC tissues compared with normal tissues. High DLAT expression correlated with a poor prognosis in patients with HCC, compared with low DLAT expression. The functions of DLAT were validated in vitro using siRNA tool and the results showed that DLAT depletion inhibited the function of proliferation and migration which indicated that DLAT may provide a potential therapeutic target for HCC.
Results
Differential expression and correlations of CRGs in HCC
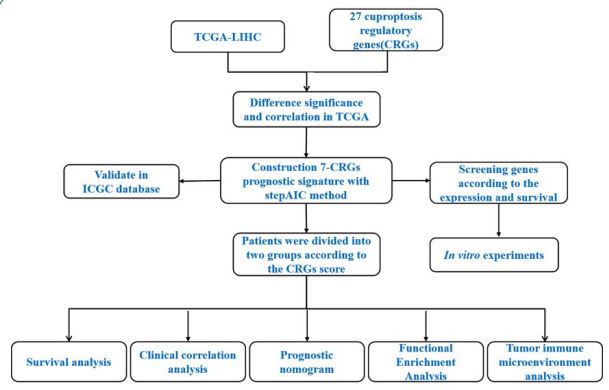
The flow chart shows the overall experimental design of this study (Figure 1). Next, we firstly curated a catalog of 27 CRGs (shown in Table S1) that function closely with cuproptosis and mitochondrial respiration. The results of GO and KEGG analysis showed that the 27 CRGs were largely related to the processes like TCA cycle, carbon metabolism, lipoic acid metabolism (Figure S1), which indicated the CRGs we selected were relative reliable. Then Principal Component Analysis (PCA) was performed based on the expressions of the CRGs, it can be seen from the figure that there is obvious classification between tumor and normal tissues (Figure 2A). Moreover, a heatmap showed the different expression of CRGs between tumor and normal tissues in HCC patients from TCGA was shown in Figure 2B. To further explore the mode of interactions between the selected CRGs, PPI analysis was retrieved via the STRING database (Figure 2C), and investigated the correlation between the expression of the CRGs, which revealed strong associations (Figure 2D). For instance, TOMM20 was highly and positively correlated with SDHB (R=-0.49, P=2.2×10⁻¹⁶) (Figure 2D).
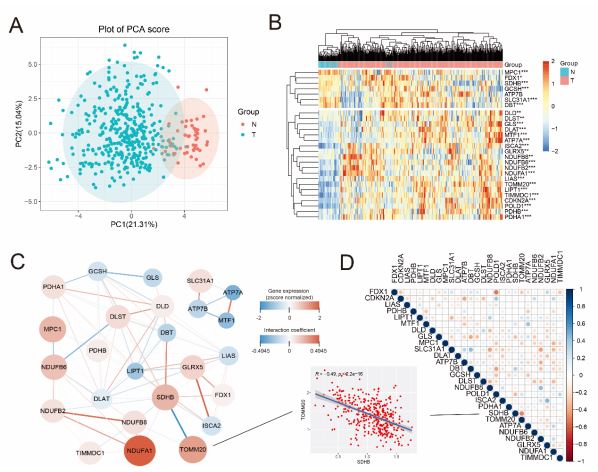
A PCA analysis for cuproptosis regulatory genes in normal and tumor group. B Heatmap of the cuproptosis regulatory genes between the normal (N, brilliant blue) and the tumour tissues (T, red). P values were showed as: **P<0.01; ***P<0.001. C PPI network showing the interactions and the correlation of the cuproptosis regulatory genes (interaction score = 0.9). (red line: positive correlation; blue line: negative correlation. The depth of the colors reflects the strength of the relevance). D The correlation analysis of the cuproptosis regulatory genes in HCC.
Development of a prognostic signature of cuproptosis regulatory genes in the TCGA cohort
The CRGs were used to develop the Risk model in TCGA cohort using the stepAIC algorithm. Univariate Cox regression analysis was performed for primary screening of the CRGs in HCC samples (Figure 3A). Among the genes which significantly higher expressed in the tumor samples, the results showed that DLAT and TIMMDC1 were significantly related to the OS (Figure 3A, P<0.05). Kaplan-Meier (KM) analysis also indicated a significant difference in the survival rate between the low- and highrisk groups (P<0.0001, Figure 3B). Importantly, according to the stepAIC algorithm, the optimal model equation was yielded using 7 factors with the lowest AIC: risk score = (0.5811 * expDLAT) + (0.2310 * expMTF1) - (0.2497 * expATP7B) + (0.2099 * expGCSH) + (0.4339 * expNDUFB2) - (0.2911 * expNDUFA1)- (0.2514 * expDLD
Patients were assigned to high- and low-risk groups according to the median risk score and the prognosis of HCC patients in the high-risk group had more deaths and a shorter survival time than those in the low-risk group (Figure 3C,D). Time-dependent Receiver Operating Characteristic (ROC) analysis was applied to evaluate the sensitivity and specificity of the prognostic model, and we found that the area under the ROC curve (AUC) was 0.677 for 1-year, 0.682 for 3-year, and 0.707 for 5-year survival (Figure 3F). Furthermore, the AUC value is time-dependent (Figure 3G) and the heatmap showed that the different expression of 7 key prognostic factors (Figure 3E). These data suggested that our prognostic risk model could predict prognosis of HCC patients from TCGA cohort. To further analyzed the potential clinical utility of the risk score, we integrated clinical information and other clinical factors, including age, gender, and tumor stage of patients. The results of multivariable Cox regression analysis showed that the risk scores were independent prognostic factors in the TCGA cohort (Figure S2A, P<0.001), furthermore, stage IV was also demonstrated to be independent prognostic factors (P=0.036). Next, we further established the prognostic nomogram to quantitatively predict the 1-, 3- and 5-year survival probability of HCC patients, demonstrating a relatively excellent predictive performance of the prognostic signature (Figure S2B).
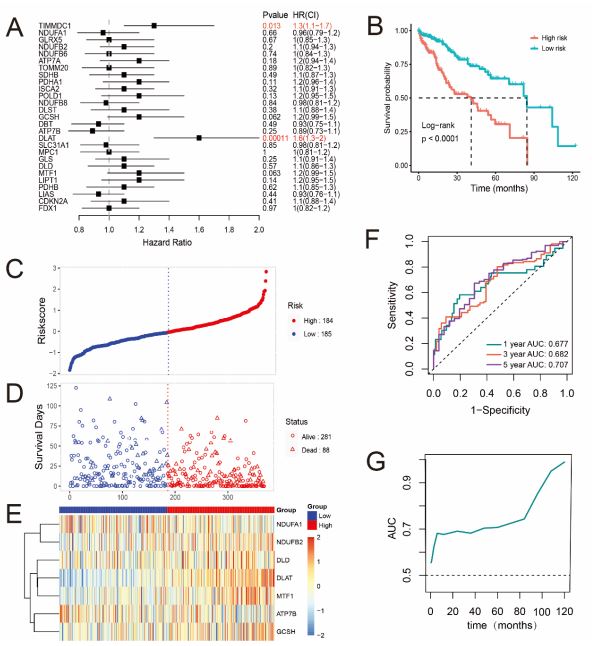
A Forest plots for the univariate cox regression analysis of CRGs. B Kaplan–Meier survival curves for HCC patients from the TCGA dataset in high- and low-risk groups. C,D Surveying the risk model in TCGA datasets: distribution of risk score and survival status of prognostic signatures in HCC patients between the high- and lowrisk groups. E The heatmap displays the distribution expression of the 7 prognostic CRGs. F The predictive efficiency of the risk score is presented by the ROC curves in TCGA dataset. G The variety of AUC value with the time.
External validation of the risk signature
To validate the accuracy of prognostic model that developed by TCGA cohort furtherly, a total of 231 HCC patients from ICGC cohort were utilized as the validation set. KM analysis also indicated a significant difference in the survival rate between the low and high-risk groups (Figure 4A) and ROC curve analysis (P<0.001) of the ICGC dataset also showed that our model had good predictive efficacy (AUC=0.697 for 3-year, and 0.635 for 5-year survival) (Figure 4B). Based on the median Risk score calculated by the same equation as above, 116 patients in the ICGC dataset were classified into the low-risk group, while the other 115 patients were classified into the high-risk group (Figure 4C) and the prognosis of HCC patients in the high-risk group still had more deaths and a shorter survival time than those in the lowrisk group (Figure 4D). Furthermore, the risk scores were also independent prognostic factors in the ICGC cohort (Figure S2C, D). Hence, these results were consistent with the results from TCGA cohort which demonstrated that the 7-genes prognostic signature could accurately predict prognosis of HCC patients.
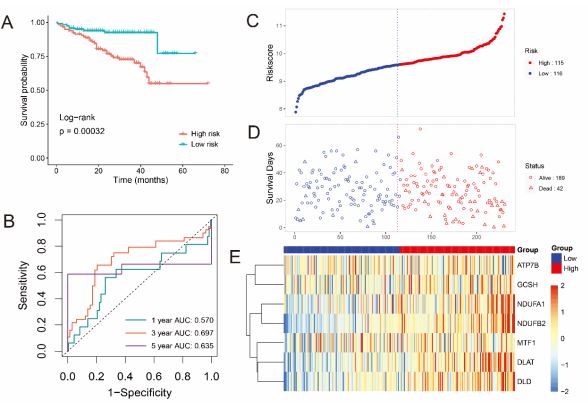
A Forest plots for the univariate cox regression analysis of CRGs. B Kaplan–Meier survival curves for HCC patients from the TCGA dataset in high- and low-risk groups. C,D Surveying the risk model in TCGA datasets: distribution of risk score and survival status of prognostic signatures in HCC patients between the high- and lowrisk groups. E The heatmap displays the distribution expression of the 7 prognostic CRGs. F The predictive efficiency of the risk score is presented by the ROC curves in TCGA dataset. G The variety of AUC value with the time.
Correlation analysis for CRGs with immune infiltration levels in HCC
It is uncertain whether CRGs would influence the tumor immune microenvironment during the HCC progression. Thus, the enrichment scores of immune cells between the low- and highrisk groups in the TCGA cohort were calculated by CIBERSORT algorithm (Figure 5A), high-risk group had higher levels of several types of immune cells, such as M0 macrophages, regulatory T cells, resting dendritic cells and memory B cell, while resting mast cells, naïve B cells, monocytes, resting NK cells were significantly abundant in the low-risk group (Figures 5A,B). In addition, the correlation between the 7 signature genes and immune infiltration in HCC was also evaluated. Notably, among the seven genes, only the expression levels of DLAT and MTF1 were associated with all the immune infiltration levels of B cells (P<0.001), CD8+ T cells (P<0.001), CD4+ T cells (P<0.001) macrophages (P<0.001), neutrophils (P<0.001) and dendritic cells (P<0.001) (Figures 5C-E), the results for correlation between the other genes and the immune infiltration cells were shown in Figure S3. These findings suggested that cuproptosis may be involved in the immune regulation of HCC progression. Of course, it needs to be verified by further experiments.
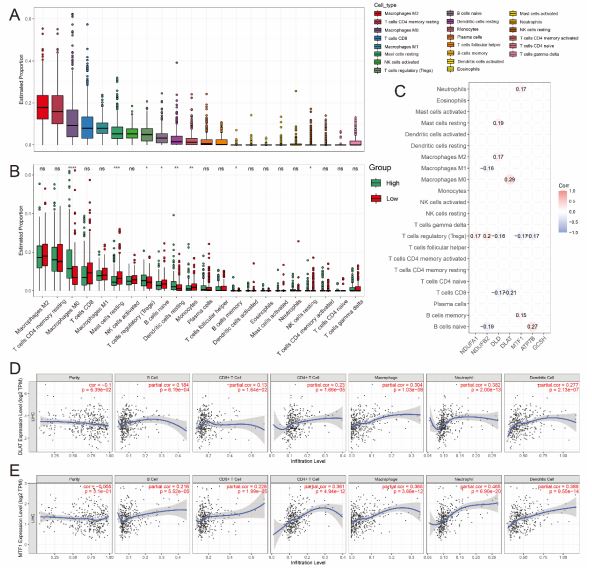
A,B Boxplots show the abundance of different types of immune cells (A) and the difference in infiltration levels of 22 immune cells (B) between two risk groups with CIBERSORT, in which green and red represent high and low risk level respectively. C Correlation analysis between the genes expression of risk CRGs and different immune infiltration cell types, only show results with p<0.05. D,E Correlation between (D) DLAT, (E) MTF1 expression and immune infiltration in HCC in the TIMER database.
Function annotation based on the risk model
To analyze the potential mechanism of the risk signature, GO, KEGG and GSEA analysis of DEGs between high- and lowrisk group were performed and according to the criteria of adj P-value < 0.05 and |log2 Fold-Change (FC)| > 1.5 were considered statistically significant. We obtained 158 down-regulated genes and 72 up-regulated genes in the high-risk group (Figure 6A and Table S4). The significant GO enrichment was observed in some types of catabolic and metabolic biological processes; For the CC and MF category, GO enrichment was observed in collagen-containing extracellular matrix and oxidoreductase activity, etc. (Figure 6B). The results of KEGG analysis indicated that the DEGs were significantly enriched in many metabolism pathways like carbon metabolism, pyruvate metabolism (Figure 6C). Moreover, GSEA results revealed that some signaling pathways, such as MYC targets, angiogenesis, glycolysis, were up-regulated in the high-Risk group of HCC (Figure 6D). Taken together, these results demonstrated that 7-CRGs risk model played an important role in various cellar processes of HCC development.
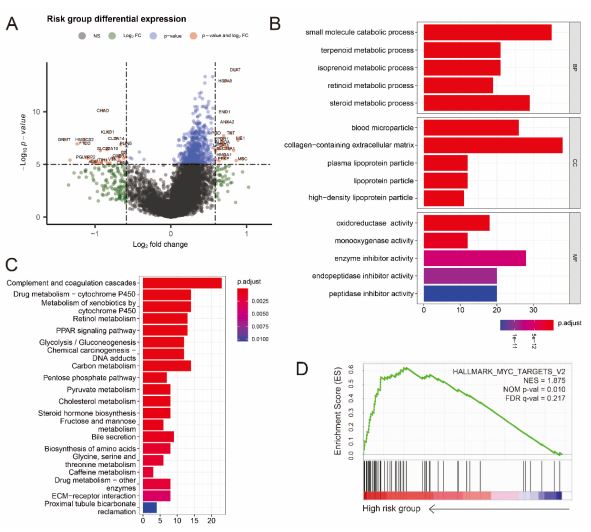
A. The volcano plot shows statistical significance (−log10 (adj P-value) plotted against log2 fold change of genes for high-risk against low-risk group. Differentially expressed genes were selected based on criteria of adjusted P<0.05 and absolute log2 fold change > 1.5. B,C Results of GO enrichment (B) and KEGG pathways (C) enrichment based on the differentially expressed genes (DEGs) between the two risk groups. D GSEA shows that genes with higher expression in the high-risk group enriched the features of HCC.
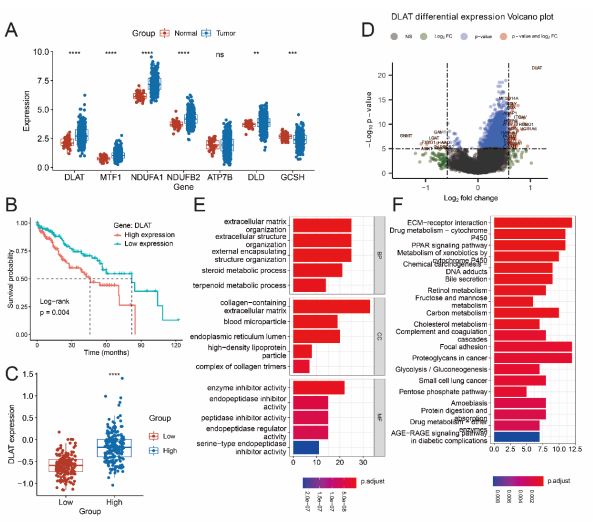
A Box plots show gene expression values for 7 risk CRGs that selected by StepAIC method. The color of blue represents tumor samples and the color of red represents normal samples. (B) OS curves for HCC patients with high and low DLAT expression. C Relative expression of DLAT between low-risk and high-risk group. D The volcano plot shows statistical significance (−log10 (adj P-value) plotted against log2 fold change of genes between high- and lowexpressed DLAT groups in HCC. E,F Results of GO (E) and KEGG pathways (F) enrichment based on the DEGs between high- and low-expressed DLAT groups in HCC.
Identifying DLAT as prognosis marker for HCC
To identify cuproptosis regulatory prognosis markers for HCC, we analyzed the expression levels of the 7 risk genes in tumor and normal tissues. Box plots showed that 6 genes were differentially expressed between normal and tumor tissues (Figure 7A,C, P<0.05). Then the survival analysis was performed for these 6 genes, surprisingly, the results showed that low DLAT expression level had significantly longer OS compared to the high DLAT expression (Figure 7B, P<0.05), while the OS was not significant between low and high expressed groups of other five genes (Figure S4).
Next, to explore the potential biological function of DLAT in HCC progression, GO enrichment and KEGG analysis were conducted on the DEGs from high expressed DLAT and low expressed DLAT groups (data are shown in Table S5). GO enrichment could be observed in some BP, CC and MF processes like ATP synthesis, respiratory electron transport chain, mitochondrial inner membrane, electron transfer activity (Figure 7E). Additionally, the DEGs were significant enriched in oxidative phosphorylation and reactive oxygen species that are closely related to the TCA cycle process based on the KEGG enrichment analysis (Figure 7F), these results suggested that DLAT was essential for mitochondrial respiration in HCC progression.
Inhibition of DLAT restrains proliferation and migration capacities of liver cancer cells
To investigate malignant biological behaviors of DLAT in vitro, we performed cellular experimental analysis in HepG2 cells by knocking down the expression of DLAT (Figure 8B). Using the MTT assay, we found down-regulated expression level of DLAT significantly suppressed the proliferative ability of HepG2 cells (Figure 8C). Transwell cell migration and colony formation assay revealed significantly decreased migrated cell numbers in DLATknockdown liver cancer cells compared with control group (Figures 8D,E). Furthermore, representative immunohistochemical staining for DLAT was higher in the liver cancer tissue than normal liver tissue (Figure 8A). These results suggested that the down-regulation of DLAT expression markedly inhibited proliferation and migration capacities of liver cancer cells, which is in consistent with its pro-tumorigenic role for patients with liver cancer. These results indicated that DLAT is likely to be a potential target for HCC therapy
Discussion
With the emergence of more and more precision therapies, the prognosis and treatment of HCC patients has improved, While the OS rates of HCC patients have not been shown an increase, and advanced HCC patients also have a poor prognosis and high recurrence rates [22,23]. Therefore, a further understanding of the genetic backgrounds and molecular mechanisms of HCC progression is essential.
RCDs are caused by dysfunctional and deregulated cell signaling and play a central role in all aspects of cell biological processes [24]. Apoptosis is the best-studied RCD form which can be the target of most cancer treatment strategies [25,26]. In addition, necroptosis, autophagy and ferroptosis were also reported to be typical markers for diagnosis and prognosis in various cancers [27-29]. However, it is necessary to find more RCD forms and have a deeper understanding of the RCD forms in tumorigenesis. Recently, cuproptosis has been identified as a novel RCD, it was used to describe the unique biological process caused by copper action and mitochondrial respiration. Previous studies demonstrated that copper serves as an important catalytic cofactor for essential enzymes involved in many cellular processes like energy conversion and oxidative metabolism regulation [5,30]. Considering that lipid acylation and Fe-S cluster proteins are widely and generally present in some metabolic processes and produced by cuproptosis, therapeutic options for copper ions targeting tumors with this metabolic profile are promising, which showed that cuproptosis is an necessary RCD form of tumorigenesis. The importance of other RCDs had been well revealed in HCC [17,31,32], but the role of cuproptosis in HCC progression is still obscure.
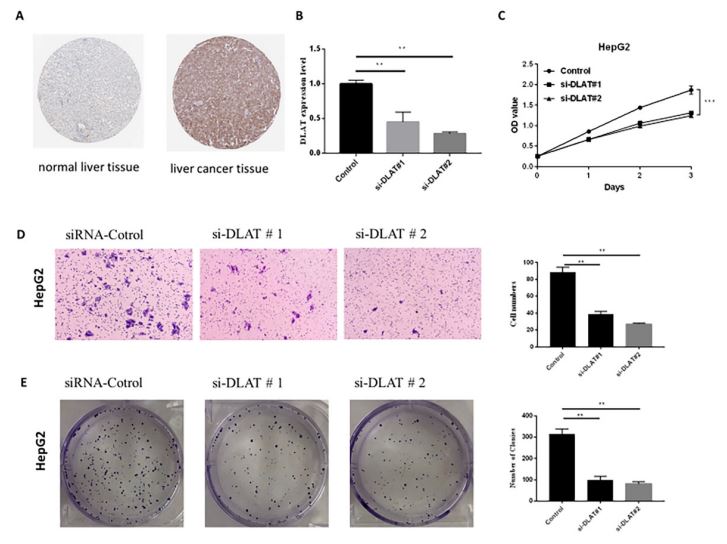
A Representative immunohistochemical staining for DLAT in normal liver tissue and liver cancer tissue, taken from the Human Protein Atlas with permission on its website. B qPCR analysis revealed the efficiency of DLAT knocking-down in HepG2 cell line. Error bars represent mean ± SD of three experimental replicates. **P<0.01. C MTT cell proliferation assay after DLAT knockdown in HepG2 cell line. Error bars represent mean ± SD of three experimental replicates. **P<0.01. D,E The transwell assay and colony formation assay were used to evaluate the migration and proliferation of HepG2 cells after knocking-down of DLAT. Graphical representation of the number of migrated HepG2 cells and formatted colonies per microscopic field. Data were shown as the mean ± SD from three independent experiments. **P<0.01, ***P<0.001.
Currently, studies have also demonstrated the potential of CRGs in constructing prognostic models in a variety of tumors, such as breast cancer [33], clear cell renal cell carcinoma and so on [28]. But the numbers CRGs that were selected in previous studies less than 20 and the genes related to the mitochondrial respiration weren’t chose for analysis. In our study, 27 genes that related to the copper metabolism and mitochondrial respiration were considered as CRGs. The expression patterns of these genes in HCC were evaluated, 26 out of 27 CRGs were upregulated as compared to normal tissues, the high expressed CRGs may be one of the reasons for elevated copper concentration in cancer progression, these results were consistent with the results of previous studies [33,34]; The OS of HCC patients in the low-risk group was significantly longer than that in the high-risk group. KM curve and the ROC curve were performed to estimate the sensitivity and specificity of the prognostic genes, which found evidence for the important role of prognostic genes in HCC development, such as GCSH and MTF1 were reported to be a prognostic genes in other studies [35]; In addition, the results of the CIBERSORT algorithm analysis revealed that high-risk group exhibited reduced tumor purity and had higher levels of several types of immune cells, including macrophages which generally play a role of protumor, in addition, high infiltration of macrophages is associated with a poor prognosis [36,37]. while T cells were significantly enriched in the low-risk group, like CD4+T or CD8+T cells are the main cells that involved in immune responses and play a role in the anti-tumor response, the high infiltration of T cells improves the prognosis of many cancer patients [38,39]. These reasons may explain the difference in prognosis between the two risk groups.
Notably, we developed a prognostic risk model based on 7 genes (NDUFA1, NDUFB2, DLD, DLAT, MTF1, ATP7B, GCSH) by performing stepAIC method and multivariate cox regression analysis. However, NDUFA1 and NDUFB2 were not reported to be as prognostic genes for HCC patients in previous studies which are essential for a functional complex I in mammalian mitochondria [40]. Tsvetkov et al reported that mitochondrial respiration regulates copper ionophore induced cell death, and it has been shown that NDUFA1 was regulated by PPARa in the oral tumor through modulating the cancer cell mitochondrial energy metabolism [41]; DLD is a redox enzyme involved in decarboxylation of pyruvate to form acetyl-CoA, treatment with DLD in a subcutaneous melanoma mice model resulted in significant tumor inhibition [42]; Intracellular GCSH concentration is a critical factor for measuring cellular metabolic status and viability and it has been shown that GCSH is an effective marker in breast cancer [43]. MTF1 is a conserved metal-binding transcription factor which is important for metal excess and deprivation. Moreover, it has been shown that MTF1 is a new marker of poor prognosis in patients with ovarian cancer [44]; ATP7B is a hepato-specific Golgi-located ATPase, which plays a key role in the regulation of copper homeostasis and signaling [45]. DLAT is the subunit E2 of the PDC complex in the catabolic glucose pathway and it plays an important role in glucose metabolism and TCA cycle [46].
KEGG pathway analysis showed that DEGs between high- and low-risk groups were significantly enriched for carbon metabolism and glycolysis. Furthermore, evidence shows that metabolic process is a critical hallmark of cancer progression. Particularly, enhanced aerobic glycolysis and impaired mitochondrial respiration have gained more attention in the metabolic study of cancers. Each mammalian cell has more than hundreds of mitochondria imperative for oxidation of metabolic fuels, bioenergetics, intracellular signaling, cell survival, and death [47]. Several mitochondrial metabolites are found crucial for supporting energy production through mitochondrial respiration in cancer cells, for example, the liver CSCs overexpress the pyruvate dehydrogenase enzyme to increase flux of the TCA cycle intermediates and show significant respiration [48]. Owing to meeting the metabolic requirements of cell proliferation, active glycolysis and TCA cycle metabolites commonly implies cancer development [49,50], Such as malignant progression, therapy resistance and immune tolerance of various cancers [51,52], thereby indicating that glycolysis and TCA cycle may be the metabolic driving force of high-risk progression. That is to say, the 7-CRGs risk signature plays crucial roles in the HCC progression and can be potential indicators of prognosis of HCC.
What’s more, low mRNA level of DLAT was found to associated with higher OS rate, suggesting that HCC patients with lower level of DLAT will get a better prognosis which showed DLAT may be a cuprpptosis related potential biomarker for HCC. DLAT was one of the components of the Pyruvate Dehydrogenase (PDH) complex. The oligomerization of DLAT was due to the integration of copper and lipoylated proteins in the TCA cycle. It has been found that DLAT or DLAT-associated pathway is a favorable prognosis in patients with lung cancer or gastric cancer [53]. Currently, in our study the function of DLAT was validated in vitro using siRNA tool and selected a typical liver cancer cell line HepG2 for further experiments on DLAT. qRTPCR showed that DLAT could be effectively silenced by two independent siRNAs. The MTT assay showed that DLAT depletion inhibited cancer cell proliferation in HepG2 cells, Subsequently, knockdown of DLAT inhibits cell clone formation and migration capability in HepG2 cells. These results suggested that DLAT can promote the proliferation and migration of HCC which turned out that DLAT is likely to be a very important potential target for the treatment of HCC. However, there are still some limitations in our study. First, it is necessary to validate the cupoptosis risk model in a clinical cohort. Second, although inhibiting the DLAT expression can significantly impair the proliferation and migration capacity of HCC, the specific mechanism need to be explored furtherly.
Materials and methods
Data acquisition
The gene expression data and corresponding clinical information of HCC samples were obtained from TCGA (https:// portal.gdc.cancer.gov/) and ICGC (https://icgc.org/) databases. The fragments per kilobase million values of TCGA were transformed into transcripts per kilobase million. For all the RNAseq data, normalization and log2(x+1) transformation were performed. 27 CRGs were retrieved from the latest literature (listed in Table S1). The tools of STRING (https://string-db.org/) and Cytoscape (https://cytoscape.org/) were used to construct the selected genes Protein-Protein Interaction (PPI) networks.
Construction of risk prognostic signature
To investigate the prognostic value of the selected genes, we first used univariate Cox regression analysis of the CRGs and then the stepAIC algorithm was used to construct a prognostic risk model. Based on the prognostic potential and the regression coefficient, seven genes were identified and the risk signature was finally developed. The risk score of every HCC patient was calculated according to the formula:
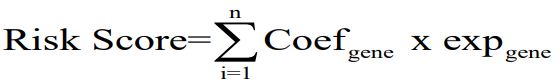
Coef indicating the coefficient and exp is the expression level of genes. Patients with a risk score above the median value were classified as the high-risk group, while the remaining HCC patients were identified as the low-risk group.
Survival analysis
Kaplan-Meier survival analysis of the gene signature from TCGA and ICGC dataset, comparison among different groups was made by log-rank test. For Kaplan-Meier curves, p values and Hazard Ratio (HR) with 95% Confidence Interval (CI) were generated by log-rank tests and univariate cox proportional hazards regression. HR represents the hazard ratio of the lowexpression sample relatives to the high-expression sample. HR>1 indicates the gene is a risk factor, and HR<1 indicates the gene is a protective factor. The predictive efficiency of genes for 1-, 3-, 5-year survival were estimated using the Receiver Operating Characteristic (ROC) curves by the “time ROC” package. Performing univariate and multivariate cox regression analyses, clinical features (age, gender, T, N, M, and tumor stage) and risk scores were used to identify the proper terms to build the nomogram. The forest was used to show the p value, HR, and 95% CI of each variable through the “forest plot” R package.
Immune-related functional analysis
To explore the relationship between risk scores and infiltration of immune cell, we quantified the abundance of immune cells in the two risk groups using algorithms such as TIMER (https://cistrome.shinyapps.io/timer/), CIBERSORT (https:// cibersortx.stanford.edu/). All the analysis methods and R package used in immune score analysis were implemented by R (version 4.0.3) and software packages “ggplot2”.
Functional enrichment analysis
The data was analyzed by functional enrichment to clarify further the function underlying potential targets. To better understand the carcinogenesis of mRNA, “Cluster Profiler” package in R was employed to analyze the GO function of potential targets and enrich the KEGG pathway. The DEGs (differential expressed genes) were identified in the high-risk and low-risk groups or the DEGs between DLAT expression high-group and low-group were calculated by the limma package, then screened with FDR < 0.05 and |Fold change| > 1.5 to identify the differences. The enriched results for GO and KEGG analysis were visualized by “ggplot2” package.
Statistical analysis
The R software “ggplot2” package was used to draw boxplot and “heatmap” package was used to draw the heatmap. The predictive efficiency of genes for Overall Survival (OS) was estimated using the Receiver Operating Characteristic (ROC) curves by the “time ROC” package. The statistical difference between the two groups was compared through the Wilcox test. p-value <0.05 was considered statistically significant.
Cell culture
Liver cancer cell line-HepG2 was purchased from the Chinese Academy of Sciences. HepG2 was cultured in DMEM (Gibco, USA) containing 10% fetal bovine serum (FBS; Gibco, USA) and placed in an incubator at a constant temperature of 37°C and carbon dioxide concentration of 5%, All cells were tested negative for mycoplasma contamination using MycoAlert Mycoplasma Detection Kit (Lonza, Switzerland).
qPCR analysis
Total RNA was extracted using TRIzol Reagent (TakaRa, Japan). RNA concentration was calculated by the A260/A280 ratio with the aid of Nanodrop 2000 spectrophotometer. Reverse transcription reactions were performed via the PrimeScript RT reagent Kit (Beytime, China). RT-qPCR reaction was marked by SYBR-Green PCR Reagent (Beytime, China) and tracked on the ABI Prism 7500 sequence detection system. GAPDH was employed as the reference gene. The list of siRNA and primer sequences was shown in Supplementary Table S2 and S3.
Cell viability
HepG2 cells were plated into 6-well plate and then transfected the si- DLAT or si-scrambled siRNA into the cells. 24 hours after transfection, 3000-4000 cells were put into the 96-well plates, incubated for another 24 h, 36 h, 48 h, then the cell viability was measured by the MTT assay.
Transwell assay
The migration of HepG2 cells was determined in a transwell chamber (Corning, USA) containing a polycarbonate filter with a pore size of 8μm. si- DLAT or si-scrambled siRNA was transfected into the cells then the cells were collected and resuspended in serum-free DMEM medium, 5×10⁵ -106 cells/ml solution was added to the upper compartment of each chamber. The lower compartment contained 0.6 ml DMEM medium with 10% FBS. After incubation for 12 h or 24h at 37℃, the filter was removed and fixed with 4% paraformaldehyde. Cells on the lower surface of the filter were stained with 1% crystal violet and photographed by Carl Zeiss Axio Observer (ZEISS).
Clone formation assay
HepG2 cells were transfected with si- DLAT or si-scrambled siRNA then seeded into 60 mm dishes, 500 cells/dish, after 14 days incubation, the cells were treated with methanol to fix the cells for 20 min at room temperature, then the cells were stained with 0.1% crystal violet for 10~20 min and wash the cells with water until excess dye is removed, and then take photos by camera.
Conclusion
In conclusion, our study developed a risk model based on 7 CRGs and the model we constructed can predicted the prognosis of HCC patients effectively. Through a series of experiments in vitro, we found DLAT showed strong influence in the proliferation and migration of liver cancer cells, which indicates that DLAT may be a very important target for the treatment of HCC. Our study provide promising evidence for further analysis of cuproptosis regulatory genes on HCC.
Abbreviations: RCD: Regulated Cell Death; TCGA: The Cancer Genome Atlas; ICGC: International Cancer Genome Consortium; OS: Overall Survival; HCC: Hepatocellular Carcinoma; TACE: Transcatheter Arterial Chemoembolization; TCA: Tricarboxylic Acid; OXPHOS: Oxidative Phosphorylation; ATP: Adenosine Triphosphate; TIME: Tumor Immune Microenvironment; CRGs: Cuproptosis Regulatory Genes.
Declarations
Ethics approval and consent to participate: Not applicable.
Consent for publication: Not applicable.
Availability of data and material: The data sets used and/ or analyzed during the current study are available from the corresponding author on reasonable request.
Competing interests: The authors declare no competing interests.
Funding: This work was supported by a grant from Postdoctoral Science Foundation of China (2022M712888).
Authors’ contributions: XWG designed the project and revised the manuscript, ZTL performed the experiments and manuscript draft; WJW was responsible for bioinformation analysis and data curation; All authors have read and approved the final vision of the manuscript.
References
- Sun Y, Wu L, Zhong Y, Zhou K, Hou Y, Wang Z et al. Single-cell landscape of the ecosystem in early-relapse hepatocellular carcinoma. Cell. 2021; 184: 404-421.e416.
- Kulik L, El-Serag HB. Epidemiology and Management of Hepatocellular Carcinoma. Gastroenterology. 2019; 156: 477-491.e471.
- Fu Y, Liu S, Zeng S, Shen H. From bench to bed: The tumor immune microenvironment and current immunotherapeutic strategies for hepatocellular carcinoma. J Exp Clin Cancer Res. 2019; 38: 396.
- Jemal A, Ward EM, Johnson CJ, Cronin KA, Ma J, et al. Annual Report to the Nation on the Status of Cancer, 1975-2014, Featuring Survival. J Natl Cancer Inst. 2017; 109.
- Kim BE, Nevitt T, Thiele DJ. Mechanisms for copper acquisition, distribution and regulation. Nat Chem Biol. 2008; 4: 176-185.
- Blockhuys S, Wittung-Stafshede P. Roles of Copper-Binding Proteins in Breast Cancer. Int J Mol Sci. 2017; 18.
- Zhang X, Yang Q. Association between serum copper levels and lung cancer risk: A meta-analysis. J Int Med Res. 2018; 46: 4863-4873.
- Xie F, Peng F. Reduction in Copper Uptake and Inhibition of Prostate Cancer Cell Proliferation by Novel Steroid-based Compounds. Anticancer Res. 2021; 41: 5953-5958.
- Basu S, Singh MK, Singh TB, Bhartiya SK, Singh SP, et al. Heavy and trace metals in carcinoma of the gallbladder. World J Surg. 2013; 37: 2641-2646.
- Li Y. Copper homeostasis: Emerging target for cancer treatment. IUBMB Life. 2020; 72: 1900-1908.
- Ascha M, Ascha MS, Tanenbaum J, Bordeaux JS. Risk Factors for Melanoma in Renal Transplant Recipients. JAMA Dermatol. 2017; 153: 1130-1136.
- Kahlson MA, Dixon SJ. Copper-induced cell death. Science. 2022; 375: 1231-1232.
- Tsvetkov P, Coy S, Petrova B, Dreishpoon M, Verma A, et al. Copper induces cell death by targeting lipoylated TCA cycle proteins. Science. 2022; 375: 1254-1261.
- Hroudová J, Fišar Z. Control mechanisms in mitochondrial oxidative phosphorylation. Neural Regen Res. 2013; 8: 363-375.
- Hu B, Yu M, Ma X, Sun J, Liu C, et al. IFNα Potentiates Anti-PD-1 Efficacy by Remodeling Glucose Metabolism in the Hepatocellular Carcinoma Microenvironment. Cancer Discov. 2022; 12: 1718-1741.
- Liang JY, Wang DS, Lin HC, Chen XX, Yang H, et al. A Novel Ferroptosis-related Gene Signature for Overall Survival Prediction in Patients with Hepatocellular Carcinoma. Int J Biol Sci. 2020; 16: 2430-2441.
- Seehawer M, Heinzmann F, D’Artista L, Harbig J, Roux PF, et al. Necroptosis microenvironment directs lineage commitment in liver cancer. Nature. 2018; 562: 69-75.
- Fang AP, Chen PY, Wang XY, Liu ZY, Zhang DM, et al. Serum copper and zinc levels at diagnosis and hepatocellular carcinoma survival in the Guangdong Liver Cancer Cohort. Int J Cancer. 2019; 144: 2823-2832.
- Yang M, Wu X, Hu J, Wang Y, Wang Y, et al. COMMD10 inhibits HIF1α/CP loop to enhance ferroptosis and radiosensitivity by disrupting Cu-Fe balance in hepatocellular carcinoma. J Hepatol. 2022; 76: 1138-1150.
- Cobine PA, Brady DC. Cuproptosis: Cellular and molecular mechanisms underlying copper-induced cell death. Mol Cell. 2022; 82: 1786-1787.
- Guan X, Deng H, Choi UL, Li Z, Yang Y, et al. EZH2 overexpression dampens tumor-suppressive signals via an EGR1 silencer to drive breast tumorigenesis. Oncogene. 2020; 39: 7127-7141.
- Reig M, Forner A, Rimola J, Ferrer-Fàbrega J, Burrel M, et al. BCLC strategy for prognosis prediction and treatment recommendation: The 2022 update. J Hepatol. 2022; 76: 681-693.
- Tabrizian P, Jibara G, Shrager B, Schwartz M, Roayaie S. Recurrence of hepatocellular cancer after resection: patterns, treatments, and prognosis. Ann Surg. 2015; 261: 947-955.
- Kist M, Vucic D. Cell death pathways: Intricate connections and disease implications. Embo j. 2021; 40: e106700.
- Qi X, Li Q, Che X, Wang Q, Wu G. Application of Regulatory Cell Death in Cancer: Based on Targeted Therapy and Immunotherapy. Front Immunol. 2022; 13: 837293.
- Tang D, Kang R, Berghe TV, Vandenabeele P, Kroemer G. The molecular machinery of regulated cell death. Cell Res. 2019; 29: 347-364.
- Ping S, Wang S, Zhao Y, He J, Li G, et al. Identification and validation of a ferroptosis-related gene signature for predicting survival in skin cutaneous melanoma. Cancer Med. 2022; 11: 3529-3541.
- Bian Z, Fan R, Xie L. A Novel Cuproptosis-Related Prognostic Gene Signature and Validation of Differential Expression in Clear Cell Renal Cell Carcinoma. Genes (Basel). 2022; 13.
- Li H, Li L, Xue C, Huang R, Hu A, et al. A Novel Ferroptosis-Related Gene Signature Predicts Overall Survival of Breast Cancer Patients. Biology (Basel). 2021; 10.
- Rae TD, Schmidt PJ, Pufahl RA, Culotta VC, O’Halloran TV. Undetectable intracellular free copper: The requirement of a copper chaperone for superoxide dismutase. Science. 1999; 284: 805-808.
- Yao F, Deng Y, Zhao Y, Mei Y, Zhang Y, et al. A targetable LIFRNF-κB-LCN2 axis controls liver tumorigenesis and vulnerability to ferroptosis. Nat Commun. 2021; 12: 7333.
- Hou J, Zhao R, Xia W, Chang CW, You Y, et al. PD-L1-mediated gasdermin C expression switches apoptosis to pyroptosis in cancer cells and facilitates tumour necrosis. Nat Cell Biol. 2020; 22: 1264-1275.
- Sha S, Si L, Wu X, Chen Y, Xiong H, et al. Prognostic analysis of cuproptosis-related gene in triple-negative breast cancer. Front Immunol. 2022; 13: 922780.
- Bao JH, Lu WC, Duan H, Ye YQ, Li JB, et al. Identification of a novel cuproptosis-related gene signature and integrative analyses in patients with lower-grade gliomas. Front Immunol. 2022; 13: 933973.
- Liu H. Pan-cancer profiles of the cuproptosis gene set. Am J Cancer Res. 2022; 12: 4074-4081.
- Noy R, Pollard JW. Tumor-associated macrophages: from mechanisms to therapy. Immunity. 2014; 41: 49-61.
- Schreibelt G, Bol KF, Aarntzen EH, Gerritsen WR, Punt CJ, et al. Importance of helper T-cell activation in dendritic cell-based anticancer immunotherapy. Oncoimmunology. 2013; 2: e24440.
- Ribas A, Wolchok JD. Cancer immunotherapy using checkpoint blockade. Science. 2018; 359: 1350-1355.
- Cho Y, Miyamoto M, Kato K, Fukunaga A, Shichinohe T, et al. CD4+ and CD8+ T cells cooperate to improve prognosis of patients with esophageal squamous cell carcinoma. Cancer Res. 2003; 63: 1555-1559.
- Au HC, Seo BB, Matsuno-Yagi A, Yagi T, Scheffler IE. The NDUFA1 gene product (MWFE protein) is essential for activity of complex I in mammalian mitochondria. Proc Natl Acad Sci U S A. 1999; 96: 4354-4359.
- Huang YP, Chang NW. PPARα modulates gene expression profiles of mitochondrial energy metabolism in oral tumorigenesis. Biomedicine (Taipei). 2016; 6: 3.
- Dayan A, Fleminger G, Ashur-Fabian O. Targeting the Achilles’ heel of cancer cells via integrin-mediated delivery of ROS-generating dihydrolipoamide dehydrogenase. Oncogene. 2019; 38: 5050-5061.
- Adamus A, Müller P, Nissen B, Kasten A, Timm S, et al. GCSH antisense regulation determines breast cancer cells’ viability. Sci Rep. 2018; 8: 15399.
- Ji L, Zhao G, Zhang P, Huo W, Dong P, et al. Knockout of MTF1 Inhibits the Epithelial to Mesenchymal Transition in Ovarian Cancer Cells. J Cancer. 2018; 9: 4578-4585.
- Polishchuk EV, Merolla A, Lichtmannegger J, Romano A, Indrieri A, et al. Activation of Autophagy, Observed in Liver Tissues From Patients With Wilson Disease and From ATP7B-Deficient Animals, Protects Hepatocytes From Copper-Induced Apoptosis. Gastroenterology. 2019; 156: 1173-1189.e1175.
- Li C, He C, Xu Y, Xu H, Tang Y, et al. Alternol eliminates excessive ATP production by disturbing Krebs cycle in prostate cancer. Prostate. 2019; 79: 628-639.
- Vakifahmetoglu-Norberg H, Ouchida AT, Norberg E. The role of mitochondria in metabolism and cell death. Biochem Biophys Res Commun. 2017; 482: 426-431.
- Bedi M, Ray M, Ghosh A. Active mitochondrial respiration in cancer: a target for the drug. Mol Cell Biochem. 2022; 477: 345-361.
- Xu F, Guan Y, Xue L, Huang S, Gao K, et al. The effect of a novel glycolysis-related gene signature on progression, prognosis and immune microenvironment of renal cell carcinoma. BMC Cancer. 2020; 20: 1207.
- Lunt SY, Vander Heiden MG. Aerobic glycolysis: Meeting the metabolic requirements of cell proliferation. Annu Rev Cell Dev Biol. 2011; 27: 441-464.
- Eniafe J, Jiang S. The functional roles of TCA cycle metabolites in cancer. Oncogene. 2021; 40: 3351-3363.
- Ganapathy-Kanniappan S, Geschwind JF. Tumor glycolysis as a target for cancer therapy: progress and prospects. Mol Cancer. 2013; 12: 152.
- Chen Q, Wang Y, Yang L, Sun L, Wen Y, et al. PM2.5 promotes NSCLC carcinogenesis through translationally and transcriptionally activating DLAT-mediated glycolysis reprograming. J Exp Clin Cancer Res. 2022; 41: 229.