
Journal of Gastroenterology Research and Practice
Research Article - Open Access, Volume 3
Study on the mechanism of action of “Astragalus-Vespae Nidus” in the treatment of gastric cancer
Jiatong Liu1,2,3; Xiafei Qi1,2,3; Liuxiang Wang1,2,3; Peng Su1,2,3*
1Affiliated Hospital of Nanjing University of Chinese Medicine, Jiangsu, Nanjing 210029, China.
2Nanjing University of Chinese Medicine, Jiangsu, Nanjing 210029, China.
3Jiangsu Provincial Hospital of Chinese Medicine, Jiangsu, Nanjing 210029, China.
*Corresponding Author : Peng Su
Affiliated Hospital of Nanjing University of Chinese
Medicine, Jiangsu, Nanjing 210029, China.
Email: shupengsp@njucm.edu.cn
Received : Aug 10, 2023
Accepted : Sep 13, 2023
Published : Sep 20, 2023
Archived : www.jjgastro.com
Copyright : © Su P (2023).
Abstract
Objective: To investigate the active ingredients of “Astragalus-Vespae Nidus” and its mechanism of action on gastric cancer based on the network pharmacology method.
Methods: The active ingredients of the drugs were obtained by database search and related literature review. Predicted targets for gastric cancer were obtained using public databases. Gene Ontology (GO) and Kyoto Encyclopedia of Genomics (KEGG) pathway enrichment analyses were performed. Constructed “drug-active ingredienttarget-pathway” network diagrams, collected gene immune tissue images using the HPA database, and further collected gene expression data using the GEPIA database.
Results: There were 41 active ingredients and 90 targets of “Astragalus-Vespae Nidus” and the GO enrichment analysis involved 379 Biological Processes (BP), 340 Cellular Components (CC) and 536 Molecular Functions (MF); the KEGG pathway enrichment analysis screened 34 pathways related to gastric cancer, mainly cancer pathway, AGE-RAGE signaling pathway, etc.
Conclusions: The “Astragalus-Beehive” drug pair has anti-gastric malignant tumor effects. Human oncogene (TP53), protein kinase (SRC), recombinant human Mitogen-Activated Protein Kinase 1 (MAPK1) and Epidermal Growth Factor Receptor (EGFR) are potential targets of “Astragalus-Hive” in the treatment of gastric cancer. It is expected to provide possibility for basic experiments and theoretical support for clinical treatment.
Keywords: Gastric cancer; TCM treatment; AstragalusVespae Nidus; Network pharmacology; Molecular docking.
Citation: Liu J, Qi X, Wang L, Su P. Study on the mechanism of action of “Astragalus-Vespae Nidus” in the treatment of gastric cancer. J Gastroenterol Res. 2023; 3(7): 1159.
Introduction
Gastric Cancer (GC) is a leading contributor to global cancer incidence and mortality [1]. Since the majority of patients with gastric cancer are diagnosed at advanced stages, they are not suitable for surgery and present with locally advanced or metastatic disease [2]. The use of traditional Chinese medicine provides more possibilities for the treatment of gastric cancer. Therefore, it is particularly urgent to explore the mechanism of TCM treatment of gastric cancer, find possible drug targets, and provide basis for clinical treatment.
“Drug pair” is the smallest unit prescription, which is guided by the classical theory of Chinese medicine and follows the compatibility law of the seven emotions of Chinese medicine. It is the link between single Chinese medicine and compound medicine. Astragalus is reputed as “the strength of qi”. It is often used as the sovereign medicine in many TCM works such as Synopsis of the Golden Chamber and Treatise on Febrile Diseases. The Vespae Nidus was first recorded in the Shennong Classic of Materia Medica. It is flat in nature, shaped like a lotus canopy, light and flexible, and good at expressing itself. The “astragalus honeycomb” drug pair is mostly used to treat the “spleen deficiency” syndrome in the clinical treatment of gastric cancer [3]. The Astragalus can raise the yang and sink, support the toxin and expel pus, assist the Vespae Nidus to attack the toxin and kill insects, dispel wind and relieve pain. The combination of the two works together to improve qi, firm the surface, and detoxify and disperse knots.
At present, the mechanism of action of “Astragalus-Vespae Nidus” in the treatment of gastric cancer is still unclear, therefore, the target of “apple” in gastric cancer is predicted through network pharmacology, further validated through public platform database, and subsequently validated through molecular docking. To provide a theoretical basis for further research on “Astragalus-Vespae Nidus”.
Materials and methods
Drug main ingredients collection
The active ingredients were obtained by searching “Astragalus-Vespae Nidus“ in Traditional Chinese Medicine Database and Analysis Platform (TCMSP) [4], The main components were obtained with the criteria of strong pharmacokinetic activity, Oral Bioavailability (OB) value ≥30% and Drug-Like (DL) ≥0.18. Review of relevant literature to supplement public databases for missing active ingredients. Supplementary data were screened by reviewing the literature, SwisstADME database [5] (http://www.swissadme.ch/).
Target prediction
The chemical formulae and smile formulae corresponding to the components were collected by using the Pubchem database [6] and the chemical specialized database of the Shanghai Institute of Organic Chemistry, Chinese Academy of Sciences [7]. (http://www.organchem.csdb.cn./). The aggregated results were entered into the Swiss Target Prediction database [5] (http://www.swisstargetprediction.ch/), and the type “Homo sapiens” was selected to collect the targets.
Collect the targets by using Using “gastric cancer” as the keyword, we entered the DrugBank database [8], DisGeNET v6.0 database [9], and GeneCards human gene database [10] (www. genecards.org) .
The combined and de-duplicated target data were analyzed using VENNY 2.1.0 online [11] (https://bioinfogp.cnb.csic.es/ tools/venny/index.html) interactive software to obtain the “drug-gastric cancer” targets.
Protein-protein interactions
The Protein-Protein Interaction (PPI) network was constructed using the STRING online database [12] (https: //string-db. org/) to obtain the interaction relationships that exist between target proteins.
GO and KEGG Pathway
Bioinformatics online analysis was performed using the Metascape database [13], species “Homo sapiens”, to create enrichment analysis maps. Observe the relationship between pathway and target interactions.
Critical protein gene validation
Gene expression profiling interaction analysis [14] (GEPIA http://gepia.cancer-pku.cn/index.html) was used to analyze the mRNA expression levels of key target proteins with the top 10 degree values. (The GEPIA database contains RNA sequencing data of common malignancy samples and normal samples from TCGA and GEO databases). The analysis was performed in terms of different cancer types, different pathological stages and differential expression of patients’ survival and normal/pathological tissues.
Immunological tissue validation
The HPA database [15] (The Human Protein Atlas, https: // www.proteinatlas.org) was used to analyze the immunohistological structure of key gene proteins, compare the protein expression differences in normal gastric tissues and gastric cancer tissues, and obtain representative immunohistochemical staining images.
Molecular docking
The top 5 values of active ingredients were selected through the PDB database [16] and the crystal structures with high resolution and relatively complete structure were chosen. The crystals were preprocessed with Auto Dock Tools software to remove irrelevant ligands and non-protein molecules and formatted to set up Grid Boxes with ligands as the center, and molecular docking was performed using Autogrid to obtain binding energies.
Those with strong binding energy were selected and visualized using pymol software.
Results
Ingredients and gastric cancer effects target of “AstragalusVespae Nidus”
Using each database collection, after merging and deweighting, we finally obtained 16 active ingredients of Astragalus membranaceus and 25 active ingredients of Beehive.
After combining and de-duplicating using each database, a total of 434 predicted therapeutic targets were collected for Astragalus, 3869 therapeutic targets for Apis mellifera and 1088 targets related to. After interaction analysis (Figure 1), there are 91 therapeutic targets for gastric cancer in Astragalus and 31 in Vespae Nidus, of which 15 are common to both Astragalus and Vespae Nidus.
Drug-component-target network construction
The drug-active ingredient-pathway network diagram was constructed using cytoscape 3.7.1 software (Figure 2). The nodes in the light blue square in the diagram are the gastric cancer disease targets, and the nodes in the purple hexagon are the active ingredients of Astragalus. The nodes in the yellow diamond are the active ingredients of Vespae Niduss. The more lines connected to the node, the greater the role of the node in the network action.
Figure 2 shows that the larger degree values are HQ11 (MOL000098-Quercetin), HQ12 (MOL000422-Kaempferol), HQ1 (MOL000378-7-O-methylisomucronulatol), HQ2 (MOL000392- Formononetin), HQ8 (MOL000354-Isorhamnetin) and FF18 (2R)-5,7-dihydroxy-2-phenylchroman-4-one.
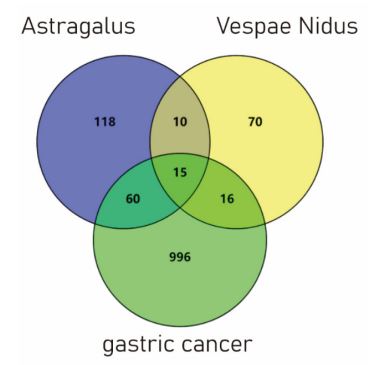
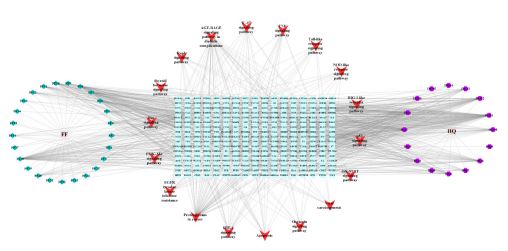
Table 1: Detailed composition information of Astragalus-Vespae Nidus.
| ID | MOL ID | NAME | OD | BL | Druglikeness | Chinese Medicine |
|---|---|---|---|---|---|---|
| HQ1 | MOL000378 | 7-O-methylisomucronulatol | 74.69 | 0.3 | Astragalus | |
| HQ2 | MOL000392 | Formononetin | 69.67 | 0.21 | Astragalus | |
| HQ3 | MOL000433 | FA (6aR,11aR)-9,10-dimethoxy-6a,11a-dihydro-6H-benzofurano [3,2- | 68.96 | 0.71 | Astragalus | |
| HQ4 | MOL000380 | c]chromen-3-ol | 64.26 | 0.42 | Astragalus | |
| HQ5 | MOL000211 | Mairin | 55.38 | 0,78 | Astragalus | |
| HQ6 | MOL000371 | 3,9-di-O-methylnissolin | 53.74 | 0,48 | Astragalus | |
| HQ7 | MOL000239 | Jaranol | 50.83 | 0.29 | Astragalus | |
| HQ8 | MOL000354 | Isorhamnetin isomucronulatol-7,2'-di-O- | 49.6 | 0.31 | Astragalus | |
| HQ9 | MOL000439 | glucosiole | 49.28 | 0.62 | Astragalus | |
| HQ10 | MOL000417 | Calycosin | 47.75 | 0.24 | Astragalus | |
| HQ11 | MOL000098 | Quercetin | 46.43 | 0.28 | Astragalus | |
| HQ12 | MOL000422 | kaempferol | 41.88 | 0.24 | Astragalus | |
| HQ13 | MOL000296 | Hederagenin 9,10-dimethoxypterocarpan-3- | 36.91 | 0.75 | Astragalus | |
| HQ14 | MOL000379 |
O---D-glucoside (3S,8S,9S,10R,13R,14S,17R)-
10,13-dimethyl-17-[(2R,5S)- 5-propan-2-yloctan-2-yl]- 2,3,4,7,8,9,11,12,14,15,16,17- dodecahydro-1H- cyclopenta[a]phenanthren- |
36.74 | 0,75 | Astragalus | |
| HQ15 | MOL000033 | 3-ol | 36.23 | 0.75 | Astragalus | |
| HQ16 | MOL000387 | Bifendate | 31.1 | 0.75 | Astragalus | |
| FF1 | MOL000579 | Hydroquinone | Vespae Nidus | |||
| FF2 | MOL002183 | 5-Propyl-2-thiouracil | Vespae Nidus | |||
| FF3 | MOL000103 | PHB | Vespae Nidus | |||
| FF4 | MOL000414 | Caffeate | Vespae Nidus | |||
| FF5 | dTMP | Vespae Nidus | ||||
| FF6 | MOL002560 | Chrysin | Vespae Nidus | |||
| FF7 | MOL000006 | Luteolin | Vespae Nidus | |||
| FF8 | MOL002563 | Galangin | Vespae Nidus | |||
| FF9 | MOL000422 | Kaempferol (2R)-5,7-dihydroxy-2- | Vespae Nidus | |||
| FF10 | MOL000246 | Phenylchroman-4-one | Vespae Nidus | |||
| FF11 | MOL004576 | Taxifolin | Vespae Nidus | |||
| FF12 | MOL000513 | 3,4,5-trihydroxybenzoic | Vespae Nidus | |||
| FF13 | MOL001801 | Salicylic acid | Vespae Nidus |
Protein-protein interaction
PPI network diagrams were obtained from STRING online data. The drug and gastric cancer intersection targets were taken and screened by taking twice the median value of Degree, and then selected by the median of Degree, Betweenness, and Closeness (Figure 3).
Obtained 26 core proteins in the PPI network. The top ten most core ones are: TP53, SRC, APP, MAPK1, EGFR, ESR1, AKT1, RB1, AR, RELA.
KEGG and GO Pathway
The results showed that the most significant pathways were pathways in cancer, PI3K-Akt signaling pathway, FoxO signaling pathway, transcriptional misregulation in cancer, calcium signaling pathway, AGE-RAGE signaling pathway in diabetic complications, chemical carcinogenesis-receptor activation, and chemical carcinogenesis-reactive oxygen species (Figure 4).
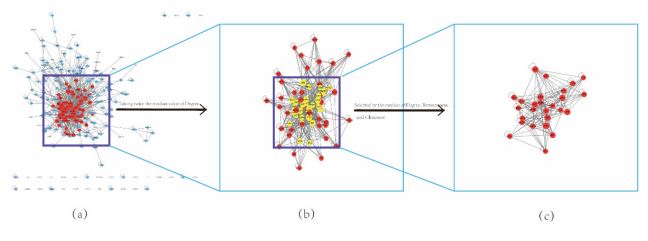
(a) complete protein interaction graph with 273 nodes and 1038 connecting lines.
(b) Protein interaction map after screening with twice the median value of degree, with 70 nodes and 602 connecting lines.
(c) Protein interaction map with high centrality of targets after screening by greater than the median of degree, betweenness and and closeness. There are 26 nodes and 65 linkages.
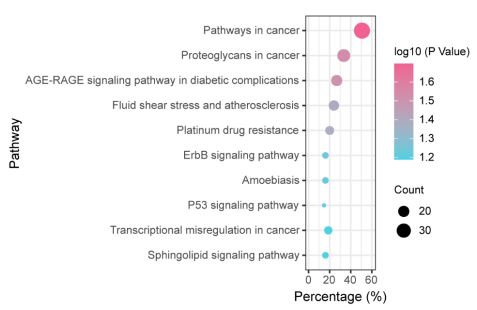
Table 2: KEGG Pathway.
| GO | Category | Description | Count | % | -Log10 (P) | Log10(q) |
|---|---|---|---|---|---|---|
| hsa05200 | KEGG Pathway | Pathways in cancer | 77 | 32.49 | 75.01 | -72.47 |
| hsa05417 | KEGG Pathway | Lipid and atherosclerosis | 43 | 18.14 | 47.19 | -44.95 |
| hsa04933 | KEGG Pathway | AGE-RAGE signaling pathway in diabetic complications | 30 | 12.66 | 38.72 | -37.02 |
| hsa05207 | KEGG Pathway | Chemical carcinogenesis-receptor activation | 37 | 15.61 | 38.18 | -36.54 |
| hsa05208 | KEGG Pathway | Chemical carcinogenesis-reactive oxygen species | 37 | 15.61 | 37.32 | -35.74 |
| hsa04151 | KEGG Pathway | PI3K-Akt signaling pathway | 40 | 16.88 | 33.54 | -32.08 |
| hsa04068 | KEGG Pathway | FoxO signaling pathway | 25 | 10.55 | 26.83 | -25.74 |
| hsa05140 | KEGG Pathway | Leishmaniasis | 18 | 7.59 | 21.14 | -20.3 |
| hsa05202 | KEGG Pathway | Transcriptional misregulation in cancer | 24 | 10.13 | 21.13 | -20.3 |
| hsa04020 | KEGG Pathway | Calcium signaling pathway | 24 | 10.13 | 18.87 | -18.14 |
| hsa01524 | KEGG Pathway | Platinum drug resistance | 16 | 6.75 | 18.36 | -17.64 |
| hsa04931 | KEGG Pathway | Insulin resistance | 18 | 7.59 | 18.31 | -17.6 |
| hsa05221 | KEGG Pathway | Acute myeloid leukemia | 15 | 6.33 | 17.39 | -16.72 |
| hsa04024 | KEGG Pathway | cAMP signaling pathway | 18 | 7.59 | 12.7 | -12.12 |
| hsa04022 | KEGG Pathway | cGMP-PKG signaling pathway | 15 | 6.33 | 11.29 | -10.75 |
| hsa04725 | KEGG Pathway | Cholinergic synapse | 13 | 5.49 | 11.23 | -10.7 |
| hsa05216 | KEGG Pathway | Thyroid cancer | 9 | 3.8 | 11 | -10.49 |
| hsa04072 | KEGG Pathway | Phospholipase D signaling pathway | 14 | 5.91 | 10.88 | -10.37 |
| hsa00910 | KEGG Pathway | Nitrogen metabolism | 7 | 2.95 | 10.52 | -10.02 |
| hsa00140 | KEGG Pathway | Steroid hormone biosynthesis | 10 | 4.22 | 10.33 | -9.84 |
GO enrichment analysis was performed using the metascape database (p<0.01) (Figure 5): 4588 enrichment results for Biological Process analysis (BP); 396 results for cellular component analysis (CC); and 613 results for Molecular Function analysis (MF).
The results of Go analysis showed that in Biological Process (BP), the main targets focused on foreign body stimulation, hormone, inorganic matter, lipopolysaccharide, oxygen level response, cell response to organic nitrogen compounds and lipids, positive regulation of cell migration, positive regulation of programmed cell death, negative regulation of cell population proliferation, positive regulation of protein phosphorylation, regulation of apoptosis signal pathway and apoptosis signal pathway, etc. In Cellular Components (CC), target actions are mainly focused on membrane rafts, vesicle lumen, transcriptional regulatory complex, nuclear membrane lumen, myelin sheath, axon, cytosol, membrane side, protein kinase complex, peroxisome, etc. In terms of Molecular Function (MF), target actions are focused on kinase binding, lipid binding, protein kinase activity, nuclear receptor activity, oxidoreductase activity, and prostaglandin receptor activity, etc.
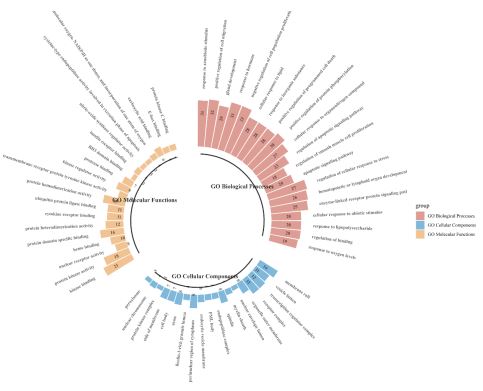
Table 3: GO enrichment analysis.
| GO | Category | Description | Count | % | Log10(P) | Log10(q) |
|---|---|---|---|---|---|---|
| GO:0045121 | GO Cellular Components | Membrane raft | 14 | 15.38 | -11.95 | -8.95 |
| GO:0031983 | GO Cellular Components | Vesicle lumen | 11 | 12.09 | -8.35 | -5,56 |
| GO:0005667 | GO Cellular Components | Transcription regulator complex | 12 | 13.19 | -7.49 | -4.93 |
| GO:0043235 | GO Cellular Components | Receptor complex | 12 | 13.19 | -7.05 | -4.76 |
| GO:0031968 | GO Cellular Components | Organelle outer membrane | 8 | 8.79 | -6.28 | -4,07 |
| GO:0005641 | GO Cellular Components | Nuclear envelope lumen | 3 | 3.3 | -5.5 | -3.39 |
| GO:0043209 | GO Cellular Components | Myelin sheath | 4 | 4.4 | -4.98 | -2,95 |
| GO:0005819 | GO Cellular Components | Spindle | 8 | 8.79 | -4.35 | -2,41 |
| GO:1905369 | GO Cellular Components | Endopeptidase complex | 4 | 4.4 | -3.97 | -2.06 |
| GO:0016605 | GO Cellular Components | PML body | 4 | 4.4 | -3.53 | -1,68 |
| GO:0030666 | GO Cellular Components | Endocytic vesicle membrane | 5 | 5.49 | -3.51 | -1.67 |
| GO:0048471 | GO Cellular Components | Perinuclear region of cytoplasm | 9 | 9.89 | -3.48 | -1.67 |
| GO:1904813 | GO Cellular Components | Ficolin-1-rich granule lumen | 4 | 4.4 | -3.26 | -1.48 |
| GO:0030424 | GO Cellular Components | Axon | 8 | 8.79 | -3.19 | -1.45 |
| GO:0044297 | GO Cellular Components | Cell body | 7 | 7.69 | -2.86 | -1.18 |
| GO:0098552 | GO Cellular Components | Side of membrane | 7 | 7.69 | -2.34 | -0.74 |
| GO:1902911 | GO Cellular Components | Protein kinase complex | 3 | 3.3 | -2.22 | -0.64 |
| GO:0000228 | GO Cellular Components | Nuclear chromosome | 4 | 4.4 | -2.19 | -0.61 |
| GO:0005777 | GO Cellular Components | Peroxisome | 3 | 3.3 | -2.04 | -0.53 |
| GO:0009410 | GO Biological Processes | Response to xenobiotic stimulus | 31 | 34.07 | -34.71 | -30.52 |
| GO:0030335 | GO Biological Processes | Positive regulation of cell migration | 32 | 35.16 | -31.67 | -27.79 |
| GO:0048732 | GO Biological Processes | Gland development | 29 | 31.87 | -31.48 | -27.77 |
| GO:0009725 | GO Biological Processes | Response to hormone | 33 | 36.26 | -28.98 | -25.74 |
| GO:0008285 | GO Biological Processes | Negative regulation of cell population proliferation | 33 | 36.26 | -28.38 | -25.19 |
| GO:0071396 | GO Biological Processes | Cellular response to lipid | 28 | 30.77 | -27.19 | -24.05 |
| GO:0010035 | GO Biological Processes | Response to inorganic substance | 28 | 30.77 | -26.77 | -23.66 |
| GO:0043068 | GO Biological Processes | Positive regulation of programmed cell death | 28 | 30.77 | -26.27 | -23.23 |
| GO:0001934 | GO Biological Processes | Positive regulation of protein phosphorylation | 30 | 32.97 | -25.17 | -22.21 |
| GO:0071417 | GO Biological Processes | Cellular response to organonitrogen compound | 27 | 29.67 | -24.11 | -21.27 |
| GO:2001233 | GO Biological Processes | Regulation of apoptotic signaling pathway | 23 | 25.27 | -23.27 | -20.48 |
| GO:0048660 | GO Biological Processes | Regulation of smooth muscle cell proliferation | 18 | 19.78 | -22.32 | -19.58 |
| GO:0097190 | GO Biological Processes | Apoptotic signaling pathway | 20 | 21.98 | -21.71 | -19 |
| GO:0080135 | GO Biological Processes | Regulation of cellular response to stress | 27 | 29.67 | -21.61 | -18.91 |
| GO:0048534 | GO Biological Processes | Hematopoietic or lymphoid organ development | 26 | 28.57 | -21.43 | -18.75 |
| GO:0007167 | GO Biological Processes | Enzyme-linked receptor protein signaling pathway | 25 | 27.47 | -20.98 | -18.33 |
| GO:0071214 | GO Biological Processes | Cellular response to abiotic stimulus | 20 | 21.98 | -20.37 | -17.77 |
| GO:0032496 | GO Biological Processes | Response to lipopolysaccharide | 20 | 21.98 | -20.29 | -17.74 |
| GO:0051098 | GO Biological Processes | Regulation of binding | 20 | 21.98 | -19.06 | -16.6 |
| GO:0070482 | GO Biological Processes | Response to oxygen levels | 19 | 20.88 | -18.9 | -16.47 |
| GO:0019900 | GO Molecular Functions | Kinase binding | 21 | 23.08 | -13.95 | -10.27 |
| GO:0004672 | GO Molecular Functions | Protein kinase activity | 18 | 19.78 | -13.09 | -9.71 |
| GO:0004879 | GO Molecular Functions | Nuclear receptor activity | 8 | 8.79 | -11.47 | -8.57 |
| GO:0020037 | GO Molecular Functions | Heme binding | 10 | 10.99 | -10.84 | -8.11 |
| GO:0019904 | GO Molecular Functions | Protein domain specific binding | 16 | 17.58 | -9.63 | -7.1 |
| GO:0046982 | GO Molecular Functions | Protein heterodimerization activity | 12 | 13.19 | -9.43 | -6.95 |
| GO:0005126 | GO Molecular Functions | Cytokine receptor binding | 11 | 12.09 | -9.19 | -6.76 |
| GO:0031625 | GO Molecular Functions | Ubiquitin protein ligase binding | 11 | 12.09 | -8.77 | -6.39 |
| GO:0042803 | GO Molecular Functions | Protein homodimerization activity | 15 | 16.48 | -8.67 | -6.31 |
| GO:0004714 | GO Molecular Functions |
Transmembrane receptor protein tyrosine kinase activity |
6 | 6.59 | -7.56 | -5.27 |
| GO:0019207 | GO Molecular Functions | Kinase regulator activity | 9 | 9.89 | -7.31 | -5.06 |
| GO:0002020 | GO Molecular Functions | Protease binding | 7 | 7.69 | -6.72 | -4.6 |
| GO:0051434 | GO Molecular Functions | BH3 domain binding | 3 | 3.3 | -6.28 | -4.22 |
| GO:0005158 | GO Molecular Functions | Insulin receptor binding | 4 | 4.4 | -6.27 | -4.21 |
| GO:0030235 | GO Molecular Functions | Nitric-oxide synthase regulator activity | 3 | 3.3 | -6.04 | -4.05 |
| GO:0097200 | GO Molecular Functions | Cysteine-type endopeptidase activity involved in execution phase of apoptosis | 3 | 3.3 | -5.66 | -3.71 |
| GO:0016709 | GO Molecular Functions | Oxidoreductase activity, acting on paired donors, with incorporation or reduction of molecular oxygen, NAD(P)H as one donor, and incorporation of one atom of oxygen | 4 | 4.4 | -5.06 | -3.18 |
| GO:0031406 | GO Molecular Functions | Carboxylic acid binding | 6 | 6.59 | -4.84 | -2.99 |
| GO:0070888 | GO Molecular Functions | E-box binding | 4 | 4.4 | -4.83 | -2.99 |
| GO:0005080 | GO Molecular Functions | protein kinase C binding | 4 | 4.4 | -4.63 | -2.8 |
Gene supplement validation
The GEPIA database was used to analyze the differences in expression of key proteins in normal versus tumor tissues under different cancer species (Figure 6a). It could be seen that the key target proteins were significantly different in normal tissues versus tumor tissues. Subsequently, further validation showed that mRNA levels in TP53, SRC, APP, AKT1, RB1, and RELA were significantly downregulated in gastric cancer tissues compared with normal tissues (Figure 6b).
Further online analysis of the effect of key target protein expression on the survival of gastric cancer patients showed that the number of patients with survival greater than 70 months was significantly reduced except for EGFR low expression, and the number of patients with survival greater than 60 months was significantly increased for other proteins low expression (Figure 7a). And the protein expression also tended to change with tumor progression (Figure 7b). This online public database collected multiple clinical cases of protein expression to plot detailed box plots (Figure 7c). It was demonstrated that, except AR expression in tumor tissues was lower than that in normal tissues, the expression of other genes was significantly higher in tumor tissues, especially TP53, SRC, APP, MAPK1, RB1 were the most obvious.
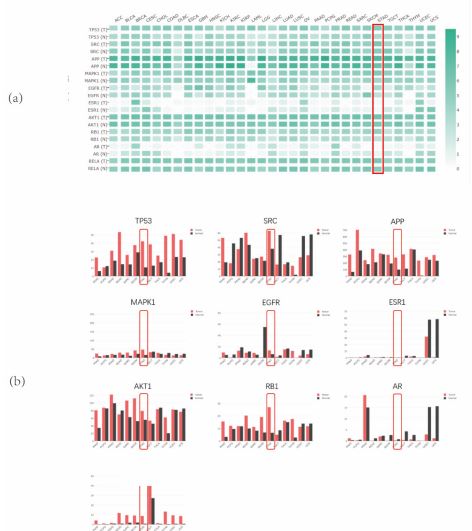
(a) Differences in expression of key proteins in normal tissues and cancerous tissues (multi cancer types) and expression of target proteins in gastric cancer are shown in red.
(b) It is about the expression box diagram to see the indivudal protein expression morevisually.
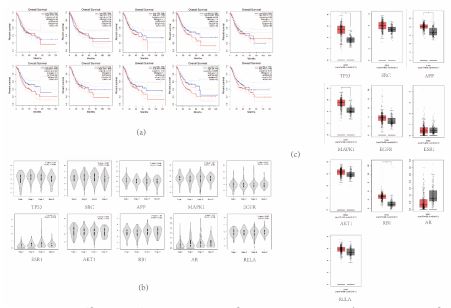
(a) Effect of high and low protein expression on patient survival.
(b) Differences in protein expression in different tumor stages.
(c) Differences in protein expression in normal and tumor tissues (detailed boxplot).
Histopathological analysis
Representative histopathological images were obtained using the online public database The Human Protein Atlas [15] (Human Protein Atlas proteinatlas.org). Figure 8 shows that the core targets were differentially expressed in normal gastric tissues except for AR and ESR1. TP53 and APP were significantly more expressed in tumor tissues than in normal gastric tissues, and SRC, MAPK1, and EGFR were significantly less expressed in tumor tissues than in gastric tissues (Figure 8).
Molecular docking verification
It is generally accepted that the lower the ligand-receptor binding energy, the more stable the conformation of the binding of ligand and receptor and the higher the possibility of binding. A docking score less than -4.25 can be considered as binding activity between the target and the component, a score less than -5.0 is better binding activity, and a score less than -7.0 is strong docking activity.
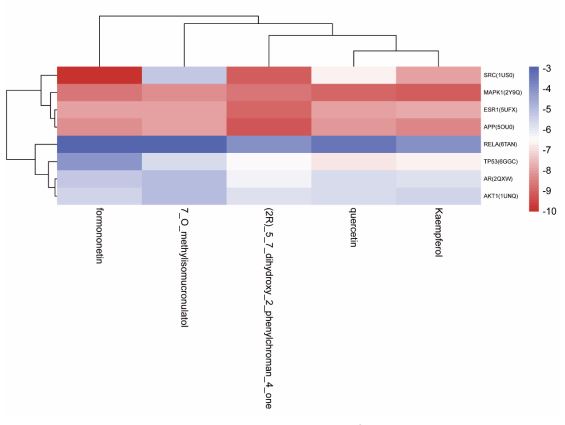
The five main active ingredients were molecularly docked to the top 10 protein targets of the enrichment analysis. The results showed that there were 28 active ingredients with binding energy less than -5 kJ/mol; 9 active ingredients less than -7 kJ/mol. The results showed that quercetin, formononetin, (2R)_5_7_dihydroxy_2_phenylchroman_4_one, Kaempferol, 7-O-methylisomucronulatol with SRC (PDB ID: 1US0[17]); MAPK1 ( PDB ID: 2Y9Q[18]); ESR1 (PDB ID: 5UFX [19]); APP (PDB ID: 5OU0 [20]) had the good binding ability. PyMOL software was used to visualize and analyze the ones with a better binding ability (Figure 9). Complete molecular docking information plotted as a heat map (Figure 10).
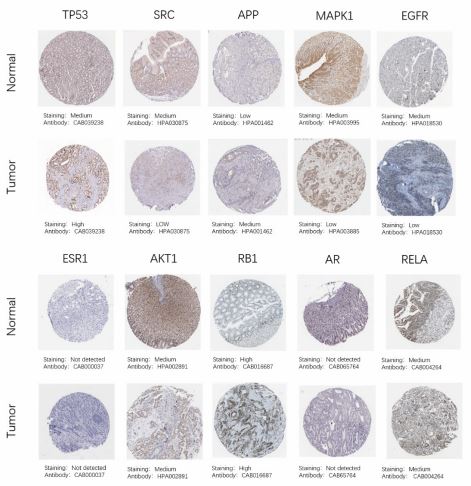
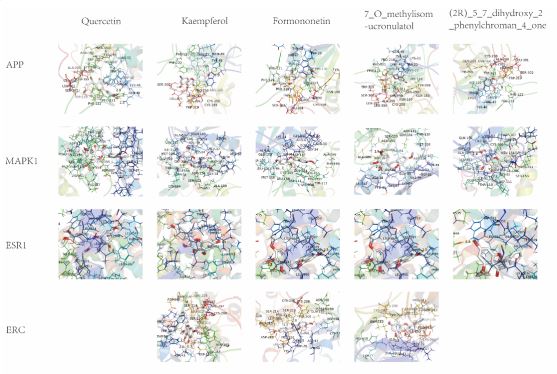
Table 4: Detailed molecular docking data.
| Combined energy (KJ/mol-1) | ||||||
|---|---|---|---|---|---|---|
| Target | Ligand | Quercetin | Formononetin | (2R)_5_7_ dihydrox y_2_phen ylchroma n_4_one | Kaempferol | 7_O_methylisomucron ulatol.pdbqt_lizhenyu |
| P53(6GGC | EDO | -6,8 | -4.7 | -5.3 | -5.3 | -4.5 |
| SRC(1US0) | NDP | -3,9 | -9.2 | -6.2 | -6.6 | -3,4 |
| RELA(6TAN | MZN | -2,9 | -2.9 | -3.2 | -3 | -2.4 |
| RB1(7D0E) | PEG | -3.3 | -3 | -3.3 | -3.4 | -3.9 |
| APK1(2Y90 | ANP | -8.3 | -7.4 | -8 | -8.4 | -6.3 |
| ESR1(5UFX | 86Y | -6,3 | -7.1 | -7,2 | -6,5 | -6.1 |
| EGFR(5UG9 | EDO | -6,3 | -6.1 | -6.2 | -6 | -5,8 |
| AR(2QXW) | CIT | -4.8 | -4.4 | -4.8 | -4.8 | -4,4 |
| APP(5OU0 | AVT | -7.4 | -7.3 | -7.5 | -7.2 | -6.9 |
| KT1(1UNC | 4IP | -5.1 | -4,7 | -4.9 | -5.1 | -4.2 |
Discussion
In this study, we analyzed the "Astragalus-Vespae Nidus" pair in terms of constituents and pathways of action and obtained the main constituents: quercetin, kaempferol, Formononetol, and isorhamnetin. The pathways associated with gastric malignancies were: Proteoglycans in cancer; p53 signaling pathway; Transcriptional misregulation in cancer; NF-kappa B signaling pathway; Chemical carcinogenesis.
The main components of the formula have been shown to have several anti-tumor and anti-inflammatory activities. Quercetin induces lysosomal activation and regulates ROS [21] synergistically leading to lipid peroxidation and iron death in tumor cells [22]. Quercetin affects changes in NF-κB activity[21], Notch/AKT/mTOR signaling pathway [23], PI3K/Akt/mTOR [24] mediating the regulation of anti-apoptotic proteins, including Bcl-2 and Bcl-xL. Kaempferol induces autophagic cell death via IRE1-JNK1 axis and HDAC/G9a pathway in gastric cancer [25]. For most cell types, Formononetin has been found to have concentration- and time-dependent effects on tumor proliferation [26-28]. The tumor-inhibitory effects of formononetin have been associated with the modulation of PI3K/AKT and STAT3 signaling pathways in both in vitro and in vivo models [29].
Cytoscape topological analysis of the protein PPI network yielded the network core proteins TP53, SRC, APP, MAPK1, EGFR, ESR1, AKT1, RB1, AR, and RELA. It is speculated that it may be the core target of the "Astragalus-Vespae Nidus" drug pair for the treatment of gastric cancer. TP53 is the most frequent mutation in gastric cancer (GC) [30]. Dysregulation of the extracellular signal-Regulated Kinase/Mitogen-Activated Protein Kinase (ERK/MAPK) signaling pathway has been widely implicated in a range of human diseases, including cancers [31-33].
The online database was supplemented to demonstrate differential expression levels of target genes in gastric cancer/normal tissue, pathological stage, and patient survival. In addition, significant differential expression of the targets was confirmed in pathological tissues. Finally, molecular docking visualization analysis demonstrated that "Astragalus-Vespae Nidus" may be used to treat gastric cancer through these pathways.
Conclusion
In this study, the molecular mechanism of action of "Astragalus-Vespae Nidus" in the treatment of gastric cancer was constructed by using various public databases and software. The topological network involves multiple components, multiple targets, and multiple pathways with potential mechanisms of action, providing a theoretical reference for the treatment of gastric cancer with “Astragalus-beehive" drug pairs. Provide more possibilities for clinical treatment of gastric cancer with traditional Chinese medicine.
Declarations
Data availability statement: Datasets of gastric cancer targets generated during this study are available in DrugBank database and the DisGeNET database repository, [DrugBank database: https://go.drugbank.com/]. [DisGeNET database : https:// www.disgenet.org].
The dataset of baicalein targets generated during this study is available in the TCMSP database, [https://tcmsp-e.com/].
The dataset of histopathological images in this study can be found in the HPA database, [https://www.proteinatlas.org/].
The protein conformation in this study can be found in the PDB database [https://www.rcsb.org/].
The gene expression levels in this study can be found in the GEPIA database, [http://gepia.cancer-pku.cn/].
Funding: This work was funded by the National Natural Science Foundation of China (nos. 81673918). Pilot GC project of clinical collaboration of traditional Chinese medicine and Western medicine on major difficult diseases in the state administration of traditional Chinese medicine; the 2019” Construction Project of Evidence-based Capacity for Traditional Chinese Medicine” (2019XZZX-ZL003) in the state administration of traditional Chinese medicine; the open program of the third phase of the program of Traditional Chinese Medicine (TCM) Advantageous Subjects (ZYX03KF020); and the Science and Technology Project of Jiangsu Provincial Administration of Traditional Chinese Medicine (ZD201803).
Authors' contributions: Jiatong Liu Performed the experiments and drafted the manuscript; Xiafei Qi co-authored the experiments; Pei-Xing Gu performed the data analysis; Liu-Xiang Wang Completed animal experiments and data collection; SiYuan Song revised the manuscript; Xiaotao Niu Finish animal experiments; Peng Shu Conceived the experiments and designed the experiments.
References
- Yeoh KG, P Tan. Mapping the genomic diaspora of gastric cancer. Nat Rev Cancer. 2022; 22: 71-84.
- Kole C, et al. Immunotherapy for gastric cancer: A 2021 update. Immunotherapy. 2022; 14: 41-64.
- Block KI, MN Mead. Immune system effects of echinacea, ginseng, and astragalus: A review. Integr Cancer Ther. 2003; 2: 247-67.
- Ru J, et al. TCMSP: A database of systems pharmacology for drug discovery from herbal medicines. J Cheminform. 2014; 6: 13.
- Daina A, O Michielin, V Zoete. SwissADME: A free web tool to evaluate pharmacokinetics, drug-likeness and medicinal chemistry friendliness of small molecules. Sci Rep. 2017; 7: 42717.
- Kim S, et al. PubChem in 2021: New data content and improved web interfaces. Nucleic Acids Res. 2021; 49: D1388-d1395.
- Shanghai Institute of Organic Chemistry of CAS. http://www.organchem.csdb.cn.
- Wishart DS, et al. DrugBank 5.0: a major update to the DrugBank database for 2018. Nucleic Acids Res, 2018; 46: D1074-d1082.
- Piñero J, et al. The DisGeNET knowledge platform for disease genomics: 2019 update. Nucleic Acids Res. 2020; 48: D845-d855.
- Safran MRN, Twik M, BarShir R, Iny Stein T, Dahary D, et al. The GeneCards Suite Chapter, Practical Guide to Life Science Databases. 2022; 27-56.
- Oliveros, J.C, Venny. An interactive tool for comparing lists with Venn’s diagrams. Venny. An interactive tool for comparing lists with Venn’s diagrams. 2007-2015.
- Szklarczyk D, et al. The STRING database in 2021: Customizable protein-protein networks, and functional characterization of user-uploaded gene/measurement sets. Nucleic Acids Res. 2021; 49: D605-d612.
- Zhou Y, et al. Metascape provides a biologist-oriented resource for the analysis of systems-level datasets. Nat Commun. 2019; 10: 1523.
- Tang Z, et al. GEPIA: A web server for cancer and normal gene expression profiling and interactive analyses. Nucleic Acids Res. 2017; 45: W98-w102.
- Uhlén M, et al. Proteomics. Tissue-based map of the human proteome. Science. 2015; 347: 1260419.
- Berman HM, et al. The Protein Data Bank. Nucleic Acids Res. 2000; 28: 235-42.
- Howard EI, et al. Ultrahigh resolution drug design I: Details of interactions in human aldose reductase-inhibitor complex at 0.66 A. Proteins. 2004; 55: 792-804.
- Garai Á, et al. Specificity of linear motifs that bind to a common mitogen-activated protein kinase docking groove. Sci Signal. 2012; 5: ra74.
- Fanning SW, et al. Specific stereochemistry of OP-1074 disrupts estrogen receptor alpha helix 12 and confers pure antiestrogenic activity. Nat Commun. 2018; 9: 2368.
- Crespo I, et al. Design, synthesis, structure-activity relationships and X-ray structural studies of novel 1-oxopyrimido[4,5-c]quinoline-2-acetic acid derivatives as selective and potent inhibitors of human aldose reductase. Eur J Med Chem. 2018; 152: 160-174.
- Ward AB, et al. Quercetin inhibits prostate cancer by attenuating cell survival and inhibiting anti-apoptotic pathways. World J Surg Oncol. 2018; 16: 108.
- Wang ZX, et al. Quercetin induces p53-independent cancer cell death through lysosome activation by the transcription factor EB and Reactive Oxygen Species-dependent ferroptosis. Br J Pharmacol. 2021. 178: 1133-1148.
- Soofiyani SR, et al. Quercetin as a Novel Therapeutic Approach for Lymphoma. Oxid Med Cell Longev. 2021; 2021: 3157867.
- Ul Islam B, et al. Flavonoids and PI3K/Akt/mTOR Signaling Cascade: A Potential Crosstalk in Anticancer Treatment. Curr Med Chem. 2021; 28: 8083-8097.
- Kim TW, et al. Kaempferol induces autophagic cell death via IRE1-JNK-CHOP pathway and inhibition of G9a in gastric cancer cells. Cell Death Dis. 2018; 9: 875.
- Wang AL, et al. Formononetin inhibits colon carcinoma cell growth and invasion by microRNA‑149‑mediated EphB3 downregulation and inhibition of PI3K/AKT and STAT3 signaling pathways. Mol Med Rep. 2018; 17: 7721-7729.
- Ye Y, et al. Formononetin-induced apoptosis of human prostate cancer cells through ERK1/2 mitogen-activated protein kinase inactivation. Horm Metab Res. 2012; 44: 263-7.
- Yang Y, et al. Formononetin suppresses the proliferation of human non-small cell lung cancer through induction of cell cycle arrest and apoptosis. Int J Clin Exp Pathol. 2014; 7: 8453-61.
- Ong SKL, et al. Focus on Formononetin: Anticancer Potential and Molecular Targets. Cancers (Basel). 2019; 11.
- Park S, et al. Clinical Relevance and Molecular Phenotypes in Gastric Cancer, of TP53 Mutations and Gene Expressions, in Combination With Other Gene Mutations. Sci Rep. 2016; 6: 34822.
- Yang X, et al. Long noncoding RNA GK-IT1 promotes esophageal squamous cell carcinoma by regulating MAPK1 phosphorylation. Cancer Med. 2022.
- Roskoski R, Targeting ERK1/2 protein-serine/threonine kinases in human cancers. Pharmacol Res. 2019; 142: 151-168.
- Ali ES, et al. ERK2 Phosphorylates PFAS to Mediate Posttranslational Control of De Novo Purine Synthesis. Mol Cell. 2020; 78: 1178-1191.e6.