
Japanese Journal of Gastroenterology Research
Research Article - Open Access, Volume 2
COL1A1 and PTGS2 as potential core genes in gastric cancer
Yang Li1; Lipeng Niu2*
1Shihua Residential District Community Health Service Center, Jinshan District, Shanghai, 201500, China.
2Affiliated Hospital of NCO School, Army Medical University, Shijiazhuang, 050000, China.
*Corresponding Author : Lipeng Niu
Affiliated Hospital of NCO School, Army Medical
University, Shijiazhuang, 050000, China.
Email: 1542264191@qq.com
Received : Sep 03, 2022
Accepted : Sep 29, 2022
Published : Oct 07, 2022
Archived : www.jjgastro.com
Copyright : © Niu L (2022).
Abstract
Background: Gastric Cancer (GC) is highly prevalent in China, where its mortality rate accounts for 50% of global GC deaths. Currently, GC pathogenesis is not fully understood.
Method: In this study, three gene expression profile datasets were retrieved from Gene Expression Omnibus (GEO) and examined to identify core GC biomarkers. First, DEGs in datasets GSE54129, GSE13911, and GSE118916 were identified using NCBI GEO2R and Venn diagram analyses. To determine functional enrichment, Gene Ontology (GO) and Kyoto Encyclopedia of Genes And Genomes (KEGG) analyses were conducted. The DEGs were identified from the Protein-Protein Interaction (PPI) network from which hub genes and gene modules were selected. Finally, we determined the impact of the hub genes on survival of GC using the GEPIA online platform.
Results: Venn diagram analysis identified 508 DEGs (117 upregulated and 331 downregulated) from the 3 gene expression datasets. The top-10 hub genes (FN1, MMP9, CXCL8, TIMP1, COL1A1, MYC, SPP1, COL3A1, COL1A2, PTGS2) were chosen from the DEG-based PPI network.
Conclusion: Using bioinformatics, GC-associate core genes with diagnostic, preventive, and therapeutic target potential were identified.
Keywords: Gastric cancer; Gene expression omnibus; Differently expressed genes; Hub genes.
Abbreviations: BP: Biological Process; CC: Cellular Component; GC: Gastric Cancer; DAVID: Database for Annotation Visualization and Integrated Discovery; DEG: Differentially Expressed Gene; GO: Gene Ontology; GEO: Gene Expression Omnibus; KEGG: Kyoto Encyclopedia of Genes and Genomes; MF: molecular function; PPI: Protein-Protein Interaction.
Citation: Li Y, Niu L. COL1A1 and PTGS2 as potential core genes in gastric cancer. Japanese J Gastroenterol Res. 2022; 2(13): 1109.
Introduction
GC is a commonly diagnosed cancer globally [1]. Increased GC screening has led to the detection of increasing GC rates [2]. Although the incidence of GC has been falling worldwide, deaths due to GC are among the highest [3]. Moreover, among these patients, the survival rate within 5 years of diagnosis is currently 20% due to the high rate of recurrence and metastasis [4]. Because of low endoscopy rates, more than 35% of Chinese GC patients have metastatic disease by the time they are diagnosed [5]. Here, we used bioinformatics to identify core genes in GC patients. First, to DEGs between GC versus normal tissues, GEO datasets were analyzed using GEO2R. The DEGs were then analyzed for pathway enrichment using GO and KEGG. Then, us ing STRING, we built a PPI network and identified GC-related hub genes and the GEPIA survival analysis tool was applied to determine the impact of the hub genes on survival of patients with GC.
Materials and methods
Data source
GC gene expression datasets were downloaded from GEO (https://www.ncbi.nlm.nih.gov/geo/). A total of 11096 series associated with human GC were retrieved from the database. After careful review, datasets GSE54129, GSE13911, and GSE118916 were selected for analyses.
Selection of DEGs
Identification of DEGs in GC tissues versus normal gastric tissues was performed using the GEO2R online analysis tool (https://www.ncbi.nlm.nih.gov/geo/geo2r/). After removing duplicate and invalid entries, and DEGs were chosen based on p=<0.05 and |logFC|>1. To perform statistical analysis on each dataset, the Venn diagram webtool (bioinformatics.psb.ugent.be/webtools/Venn/) was used., and a Venn diagram of DEGs was created and saved in SVG format.
GO and KEGG pathway analysis of DEGs
GO analysis is frequently used for functional enrichment analyses of large-scale datasets [6]. Gene functions are categorized into Molecular Function (MF), Biological Process (BP), and Cellular Component (CC). The KEGG analysis is a popular data repository for genomes, diseases, biological pathways, and chemicals [7]. GO and KEGG enrichment analyses of the DEGs were performed using DAVID website (https://david.ncifcrf.gov/). The text files of the selected results were downloaded and P<0.01 was deemed statistically significant as were gene counts ≥10.
The establishment of a PPI network and identification of a hub gene
By entering the DEGs into the search box and selecting Homo sapiens as the organism, we were able to create a Protein-Protein Interaction (PPI) network of the DEGs through STRING (http://string-db.org). Cytoscape and cytoHubba, a Cytoscape plugin that calculates protein node degrees and selects the ten top genes as hub genes, were used to build and visualize the PPI network.
Hub gene survival analysis
GEPIA, a web server, allows for the profiling of cancer, normal gene expression in addition to interactive analyses [8]. On GEPIA (http://gepia.cancer-pku.cn/), patient survival analyses were conducted. Based on each hub gene’s median mRNA expression level, cancer patients were assigned into two groups. P=<0.05 was taken as the threshold for statistical significance.
Results
DEG identification
Of the 3 gene expression datasets (GSE54129, GSE13911, and GSE118916) chosen for analysis, GSE54129 contained 111 and 21, GSE13911 had 38 and 31, and GSE118916 had 15 and 15 tumor and normal gastric specimens, respectively (Table 1). Using the p=0.05 and |logFC|>1 criterion, 3905 DEGs (1778 upregulated, 2127 downregulated), 3285 DEGs (1022 upregulated, 2263 downregulated), and 1763 DEGs (918 upregulated, 845 downregulated), were identified in datasets GSE54129, GSE13911, and GSE118916, respectively. Venn analysis identified 508 DEGs (177 significantly upregulated and 331 significantly downregulated) as being common between the 3 datasets (Figure 1).
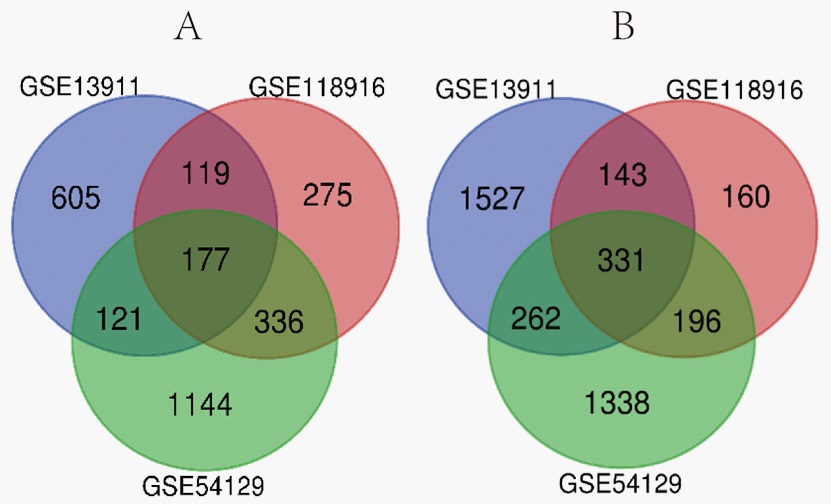
Table 1: Gene expression data extracted from the 3 GEO datasets.
Dataset |
Tumor |
Normal |
Total number |
GSE54129 |
111 |
21 |
132 |
GSE13911 |
38 |
31 |
69 |
GSE118916 |
15 |
15 |
30 |
Functional enrichment analyses
The DEGs were mostly enriched in BPs, according to GO analysis, which included digestion, the collagen catabolic process, the extracellular matrix organization, flavonoid glucuronidation, and the organization of collagen fibrils (Table 2). For CC, DEGs were found to be most abundant in extracellular spaces, exosomes, respectively, among others. DEGs involved in MF were primarily enriched in glucuronosyltransferase activity, heparin-binding, extracellular matrix structural constituent, integrin binding, and calcium ion binding. Moreover, the DEGs were found to be enriched in several pathways, including xenobiotic metabolism by cytochrome P450, drug metabolism, and chemical carcinogenesis.
Construction of a PPI network and hub gene identification
In the PPI network, 494 nodes and 1834 edges were revealed by STRING analysis of protein interaction among the DEGs (Figure 2). The top ten genes identified in the PPI network based on connectivity degree were FN1, MMP9, CXCL8, TIMP1, COL1A1, MYC, SPP1, COL3A1, COL1A2, and PTGS2 (Table 3). GEPIA survival analysis of COL1A1 and PTGS2 prognostic value in GC revealed that their high expression correlated with poor GC overall and disease-free survival (Figure 3).
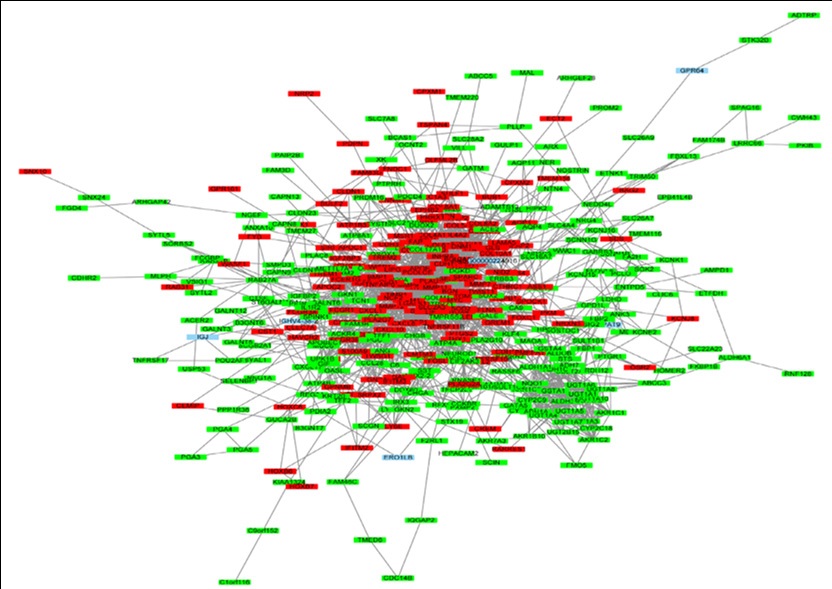
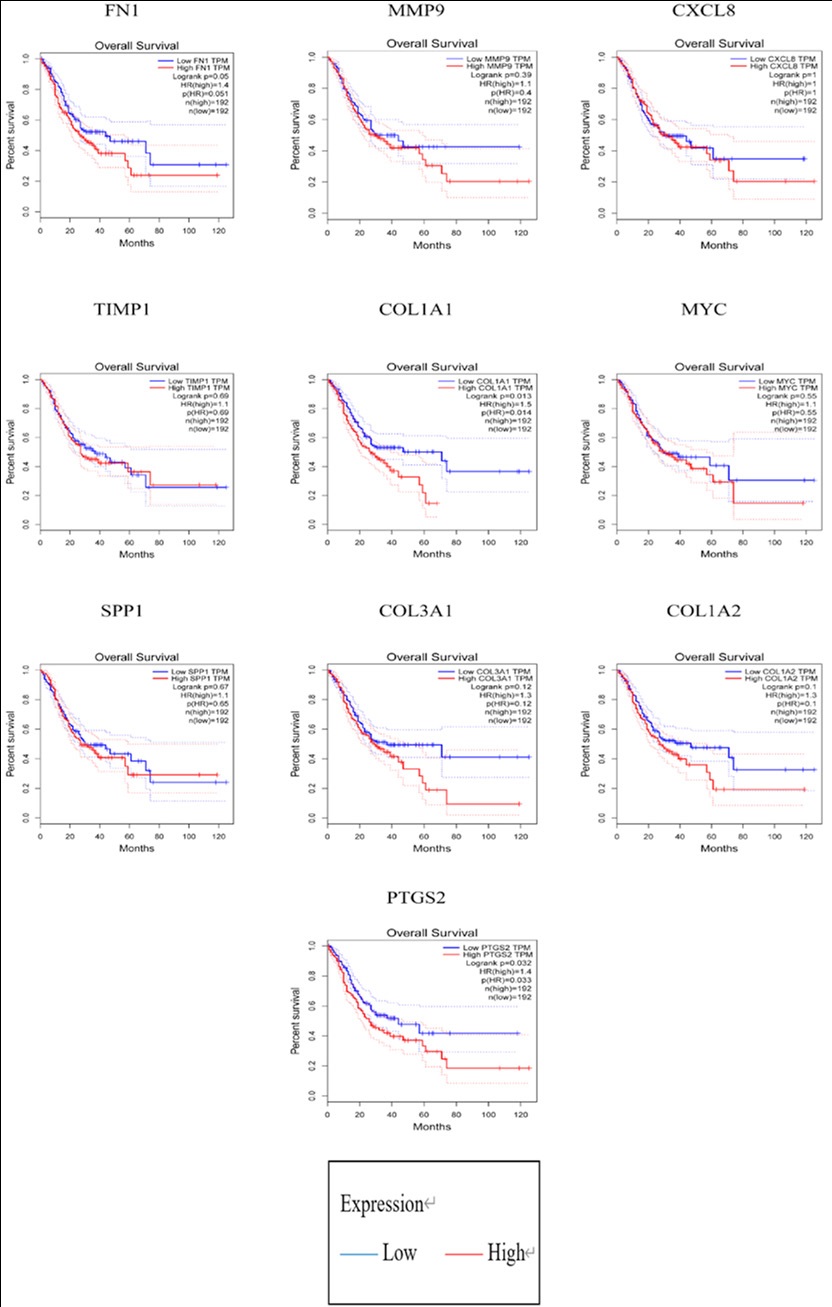
Table 2: DEGs regulate biological processes and pathways.
Category |
Term |
Description |
Count |
BP |
GO:0007586 |
digestion |
18 |
BP |
GO:0030574 |
collagen catabolic process |
18 |
BP |
GO:0030198 |
extracellular matrix organization |
26 |
BP |
GO:0052696 |
flavonoid glucuronidation |
10 |
BP |
GO:0030199 |
collagen fibril organization |
11 |
BP |
GO:0006805 |
xenobiotic metabolic process |
14 |
BP |
GO:0001503 |
ossification |
14 |
BP |
GO:0008202 |
steroid metabolic process |
10 |
BP |
GO:0007584 |
response to nutrient |
12 |
BP |
GO:0045766 |
positive regulation of angiogenesis |
14 |
BP |
GO:0042493 |
response to drug |
23 |
BP |
GO:0042127 |
regulation of cell proliferation |
17 |
BP |
GO:0001501 |
skeletal system development |
14 |
CC |
GO:0005615 |
extracellular space |
103 |
CC |
GO:0070062 |
extracellular exosome |
156 |
CC |
GO:0005576 |
extracellular region |
96 |
CC |
GO:0031012 |
extracellular matrix |
34 |
CC |
GO:0005788 |
endoplasmic reticulum lumen |
24 |
CC |
GO:0005578 |
proteinaceous extracellular matrix |
28 |
CC |
GO:0005581 |
collagen trimer |
16 |
CC |
GO:0005604 |
basement membrane |
12 |
CC |
GO:0016324 |
apical plasma membrane |
23 |
CC |
GO:0005783 |
endoplasmic reticulum |
43 |
CC |
GO:0030141 |
secretory granule |
10 |
MF |
GO:0015020 |
glucuronosyltransferase activity |
10 |
MF |
GO:0005201 |
extracellular matrix structural constituent |
13 |
MF |
GO:0008201 |
heparin binding |
18 |
MF |
GO:0005178 |
integrin binding |
14 |
MF |
GO:0005509 |
calcium ion binding |
39 |
KEGG pathway |
hsa00980 |
Metabolism of xenobiotics by cytochrome P450 |
22 |
KEGG pathway |
hsa05204 |
Chemical carcinogenesis |
22 |
KEGG pathway |
hsa00982 |
Drug metabolism - cytochrome P450 |
20 |
KEGG pathway |
hsa00830 |
Retinol metabolism |
18 |
KEGG pathway |
hsa04974 |
Protein digestion and absorption |
19 |
KEGG pathway |
hsa00140 |
Steroid hormone biosynthesis |
15 |
KEGG pathway |
hsa00040 |
Pentose and glucuronate interconversions |
11 |
KEGG pathway |
hsa00053 |
Ascorbate and aldarate metabolism |
10 |
KEGG pathway |
hsa04512 |
ECM-receptor interaction |
15 |
KEGG pathway |
hsa00860 |
Porphyrin and chlorophyll metabolism |
10 |
KEGG pathway |
hsa00983 |
Drug metabolism - other enzymes |
10 |
KEGG pathway |
hsa05146 |
Amoebiasis |
13 |
KEGG pathway |
hsa04971 |
Gastric acid secretion |
10 |
Table 3: The Top 10 in network string_interactions.tsv ranked by Degree.
Gene symbol |
Gene function |
Degree |
FN1 |
Fibronectin 1 |
75 |
MMP9 |
Matrix metallopeptidase 9 |
68 |
CXCL8 |
C-X-C motif chemokine ligand 8 |
53 |
TIMP1 |
TIMP metallopeptidase inhibitor 1 |
46 |
COL1A1 |
Collagen type I alpha 1 chain |
45 |
MYC |
MYC proto-oncogene |
44 |
SPP1 |
Secreted phosphoprotein 1 |
43 |
COL3A1 |
Collagen type III alpha 1 chain |
43 |
COL1A2 |
Collagen type I alpha 2 chain |
41 |
PTGS2 |
Prostaglandin-endoperoxide synthase 2 |
40 |
Discussion
Here, we sought to identify core GC-associated genes and uncover the mechanisms underlying their role in GC. To this end, we evaluated differential gene expression in GC tissue vs normal tissue in 3 gene expression datasets using GEO2R and identified 508 common DEGs in the 3 datasets (177 upregulated, 331 downregulated). In this study, he top ten hub genes were found to be FN1, MMP9, CXCL8, TIMP1, COL1A1, MYC, SPP1, COL3A1, COL1A2, and PTGS2. Of these, COL1A1, COL1A2, and COL3A1 belong to the Collagen family. Collagen type I alpha 1 chain (also referred to as CAFYD, EDSC, OI1, OI2, OI3, OI4, and EDSARTH1) encodes type I collagen pro-alpha1 chains, which has a triple helix made up of one alpha2 chain and two alpha1 chains. When compared to normal tissues, mRNA expression levels of COL1A1 were found to be elevated in premalignant as well as malignant tissues, while mRNA expression levels of COL1A2 were significantly elevated in malignant tissues when compared to normal and premalignant tissues. Furthermore, expression levels of COL1A1 were not correlated with clinic- pathological parameters, whereas expression of COL1A2 was correlated with tumor size and invasion depth. Additionally, COL1A1 and COL1A2 upregulation correlate with lower overall survival [9]. Silencing COL1A1 expression in BGC-823 cells significantly suppressed their cell proliferation and migration capacity [10]. MiR-129-5p, by targeting COL1A1, inhibits GC cell proliferation, migration, and invasion [11].
Collagen type I alpha 2 chains (also referred to as OI4, EDSARTH2 or EDSCV) encode type I collagen’s pro-alpha2 chain, whose triple helix is made up of one alpha2 chain and two alpha1 chains. Of the 7q21-22 candidate genes, two (SHFM1 and MCM7) were found to be expressed in intestinal-type gastric tumors, while COL1A2 was found to be expressed in diffuse-type gastric tumors.
MiR-25 has been reported to be co-expressed with SHFM1 and MCM7 in gastric tumors, and there is an inverse relationship between COL1A2 and miR-25 expression [12]. Through the PI3K- Akt signaling pathway, silencing COL1A2, THBS2 and COL6A3 suppresses GC cell proliferation, migration, as well as invasion while enhancing apoptosis [13].
Collagen type III alpha 1 chain (also referred to as EDS4A, PMGEDSV and EDSVASC) encodes type III collagens’ pro-alpha1 chains. It is a fibrillar collagen that is found in extensible connective tissues including those of the skin, uterus, lungs, intestines, and the vascular system. Mostly, it is found in association with type I collagen. The co-expression of LUM and COL3A1 indicates the importance of LUM in collagen fiber assembly [14]. COL3A1 promotes the migration of iCCA cells and is a component of tumor-associated aligned collagen [15]. KCNJ15 expression levels in ESCC cell lines vary greatly and are associated with COL3A1, JAG1, and F11R [16].
TIMP metallopeptidase inhibitor 1 is a member of the TIMP gene family. It is also referred to as EPO, EPA, HCI, CLGI, TIMP-1, or TIMP. This gene family of proteins naturally inhibits matrix metalloproteinases (MMPs), a class of peptidases that degrade the extracellular matrix. Indeed, clinical data show that clinical-stage III patients with positive clinical lymph nodes had higher levels of CK18, TIMP1 and MMP-9 than those in clinical-stage II with negative clinical lymph nodes [17]. Previous research has identified tissue inhibitor of metalloproteinase-1, serum matrix metalloproteinase-8, and the ratio of matrix metalloproteinase-8/tissue inhibitor of metalloproteinase-1 as potential GC prognosis factors [18]. In a GC cell line, IL12A suppressed tissue inhibitors of metalloproteinase 1 expression while elevating insulin-like growth factor- binding protein 1 and plasminogen activator inhibitor 1 expression levels [19]. Matrix metallopeptidase 9 is also known as GELB, CLG4B, MMP-9, or MANDP2. During normal physiological processes, including embryonic development, tissue remodeling and reproduction, as well as in disease processes such as metastasis and arthritis, matrix metalloproteinases degrade the extracellular matris. According to previous research, SETDB1 overexpression in GC upregulates CCND1 and MMP9 to influence gastric carcinogenesis and metastasis [20]. MMP 9, KLK6, and VEGF were significantly elevated in GC cell lines (SGC-7901, MKN-28, BGC-823, and MGC-803) when compared to the normal gastric epithelial cell line (GES-1) [21]. VGLL1 phosphorylation via TGF-β/ERK/RSK2 signaling has a crucial role in MMP9-driven GC [22].
Fibronectin 1 (also referred to as FN, FNZ, CIG, MSF, FINC, ED-B, GFND, GFND2, LETS, or SMDCF) encodes fibronectin, a glycoprotein. In plasma, fibronectin occurs in a soluble dimeric form while in the extracellular matrix and at the cell surface, it occurs in a dimeric or multimeric form. Impaired FN1 expression significantly suppressed proliferation, migration, invasion, and EMT in GC cells, while enhancing apoptosis [23]. CDH1 expression in CRLM and non-tumor liver tissues were comparable, whereas FN1 and VIM expression in metastatic tissue was significantly lower [24]. Furthermore, in cell lines and GC tissues, miR-200c was reported to be significantly downregulated, whereas FN1 showed the opposite pattern [25].
C-X-C motif chemokine ligand 8 (also referred to as NAF, IL8, GCP1, LUCT, LECT, NAP1, LYNAP, GCP-1, MDNCF, NAP-1, MONAP, or SCYB8) encodes a CXC chemokine family member that is important in mediating inflammatory responses. CXCL8 is primarily secreted by macrophages and helps to create an immunosuppressive microenvironment by inducing PD- L1+CXCL8 [26]. CXCL7 and CXCL1 are CXCR2 ligands that may influence GC malignant progression via CXCR2 signaling [27]. The PTPRD-CXCL8 axis may have therapeutic potential, particularly for metastasis suppression in PTPRD-inactivated GCs [28].
MYC is a bHLH transcription factor that has an impact on cell cycle apoptosis, progression, and cellular transformation. It is also known as MRTL, MYCC, c-Myc, or bHLHe39. MYC activity and CCNE1 amplification may be associated with immune-deficient CIN GEAs, to allow for the study of immune evasion mechanisms, ultimately inspiring new therapeutic modalities [29].
Gastric carcinogenesis is initiated by YAP/TAZ activation, with MYC acting as a key downstream mediator [30]. KLF5, MYC/LINC00346/miR-34a-5p axis is an effector of GC tumorigenesis and may have therapeutic target potential against GC [31].
Secreted phosphoprotein 1 (BNSP, OPN, ETA-1 or BSPI) helps osteoclasts adhere to the mineralized bone matrix. Through PI3K/AKT signaling, MiR-340 targeting of SPP1 may suppress GC cell proliferation, migration, invasion, as well as EMT. SPP1 silencing by MiR- 340 suppresses GC cell proliferation, invasion, migration, and EMT while promoting GC cell apoptosis [32]. Multivariate analysis revealed that high epithelial PDGFRB levels (p=0.036 and p=0.02) and SPP1 (p=0.003 and p<0.001) are independent prognostic factors for GC DFS and OS [33].
Prostaglandin-endoperoxide synthase 2 (also referred to as COX-2, COX2, PHS-2, PGHS-2, PGG/HS, GRIPGHS or hCox-2) is a dioxygenase and peroxidase enzyme involved in prostaglandin biosynthesis. Clinical specimen analysis revealed that PTGS2 and BCL2 were positively correlated with human GC. Furthermore, xenograft models revealed that inhibiting PTGS2 with celecoxib significantly increased cisplatin cytotoxicity in resistant GC by suppressing PTGS2 and BCL2 expression, which is regulated by the ERK1/2 and P38 signaling axis, implying that PTGS2 may have adjunctive therapeutic potential for chemoresistance reversal in a subset of cisplatin-resistant GC [34]. These findings indicate that lycopene induces apoptosis and inhibits proliferation in AGS cells by inhibiting the ROS-activated EGFR/Ras/ERK as well as the p38 MAPK pathways, as well as the NF-B-mediated COX-2 gene expression. It has been proposed that lycopene-rich foods may reduce the incidence of GC [35]. Overexpressed LMP1 and LMP2A suppresses COX-2 via a decrease in TRAF2. In GC, P-ERK is involved in COX-2 inhibition by LMP1 [36]. GC patients with low COL1A1 and PTGS2 expression had significantly better overall survival, according to survival analysis.
Conclusion
Here, 508 DEGs (177 upregulated, 331 downregulated) were identified in GC vs normal gastric tissues using bioinformatic analysis of GEO gene expression datasets. Of these, 10 hub genes (FN1, MMP9, CXCL8, TIMP1, COL1A1, MYC, SPP1, COL3A1, COL1A2, and PTGS2) that may be core GC genes were selected. COL1A1 and PTGS2 are potential core genes in gastric cancer. Further studies are needed to validate our findings.
Declarations
Acknowledgments: We acknowledge GEO database for providing their platforms and contributors for uploading their meaningful datasets.
Authors’ contributions: YL collected and analyzed the data. LN designed and supervised the study. YL drafted the first version of the manuscript. YL, LN reviewed and revised the manuscript. LN constructed the diagrams and tables of the article. All authors read and approved the final manuscript.
Funding: None.
Conflict of interest: The author(s) declared no potential conflicts of interest with respect to the research, authorship, and/or publication of this article.
Ethics approval: Our study did not require an ethical board approval because it did not contain human or animal trials.
Consent to participate: Not applicable.
Consent for publication: Not applicable.
Availability of data and materials: The datasets used and/or analysed during the current study are available from the corresponding author on reasonable request.
Code availability: Not applicable.
References
- Liu J, Ma L, Xu J, Liu C, Zhang J, et al. Spheroid Body-Forming Cells in the Human Gastric Cancer Cell Line Mkn-45 Possess Cancer Stem Cell Properties. Int J Oncol. 2013; 42: 453-459.
- Ryu DG, Choi CW, Kim SJ, Kang DH, Kim HW, et al. Possible Indication of Endoscopic Resection in Undifferentiated Early Gastric Cancer. Sci Rep. 2019; 9.
- Tsurudome I, Miyahara R, Funasaka K, Furukawa K, Matsushita M, et al. In Vivo Histological Diagnosis for Gastric Cancer Using Endocytoscopy. World J Gastroenterol. 2017; 23: 6894-6901.
- Wang R, Deng X, Yuan C, Xin H, Liu G, et al. Ift80 Improves Invasion Ability in Gastric Cancer Cell Line Via Ift80/P75ngfr/Mmp9 Signaling. Int J Mol Sci. 2018; 19.
- Ding X-Q, Wang Z-Y, Xia D, Wang R-X, Pan X-R, et al. Proteomic Profiling of Serum Exosomes from Patients with Metastatic Gastric Cancer. Front Oncol. 2020; 10.
- Zhao Z, Bai J, Wu A, Wang Y, Zhang J, et al. Co-Lncrna: Investigating the Lncrna Combinatorial Effects in Go Annotations and Kegg Pathways Based on Human Rna-Seq Data. Database-the Journal of Biological Databases and Curation. 2015.
- Yuan C, Zhang Y, Tu W, Guo Y. Integrated Mirna Profiling and Bioinformatics Analyses Reveal Upregulated Mirnas in Gastric Cancer. Oncol Lett. 2019; 18: 1979-1988.
- Zhang Y, Mo W-J, Wang X, Zhang T-T, Qin Y, et al. MicroarrayBased Bioinformatics Analysis of the Prospective Target Gene Network of Key Mirnas Influenced by Long Non-Coding Rna Pvt1 in Hcc. Oncol Rep. 2018; 40: 226-240.
- Li J, Ding Y, Li A. Identification of Col1a1 and Col1a2 as Candidate Prognostic Factors in Gastric Cancer. World J Surg Oncol. 2016; 14.
- Li A-Q, Si J-M, Shang Y, Gan L-H, Guo L, et al. Construction of Col1a1 Short Hairpin Rna Vector and Its Effect on Cell Proliferation and Migration of Gastric Cancer Cells. Zhejiang da xue xue bao Yi xue ban = Journal of Zhejiang University Medical sciences. 2010; 39: 257-263.
- Wang Q, Yu J. Mir-129-5p Suppresses Gastric Cancer Cell Invasion and Proliferation by Inhibiting Col1a1. BCB. 2018; 96: 19-25.
- Sembulingam T, Rathinam D, Ganesan K. Amplified 7q21-22 Gene Mcm7 and Its Intronic Mir-25 Suppress Col1a2 Associated Genes to Sustain Intestinal Gastric Cancer Features. Mol Carcinog. 2017; 56: 1590-1602.
- Ao R, Guan L, Wang Y, Wang J-N. Silencing of Col1a2, Col6a3, and Thbs2 Inhibits Gastric Cancer Cell Proliferation, Migration, and Invasion While Promoting Apoptosis through the Pi3k-Akt Signaling Pathway. J Cell Biochem. 2021; 122S102.
- Klejewski A, Sterzynska K, Wojtowicz K, Swierczewska M, Partyka M, et al. The Significance of Lumican Expression in Ovarian Cancer Drug-Resistant Cell Lines. Oncotarget. 2017; 8: 74466- 74478.
- Carpino G, Overi D, Melandro F, Grimaldi A, Cardinale V, et al. Matrisome Analysis of Intrahepatic Cholangiocarcinoma Unveils a Peculiar Cancer-Associated Extracellular Matrix Structure. Clin Proteomics. 2019; 16.
- Nakamura S, Kanda M, Koike M, Shimizu D, Umeda S, et al. Kcnj15 Expression and Malignant Behavior of Esophageal Squamous Cell Carcinoma. Ann Surg Oncol. 2020; 27: 2559-2568.
- Peduk S, Tatar C, Dincer M, Ozer B, Kocakusak A, et al. The Role of Serum Ck18, Timp1, and Mmp-9 Levels in Predicting R0 Resection in Patients with Gastric Cancer. Dis Markers. 2018; 2018.
- Laitinen A, Hagstrom J, Mustonen H, Kokkola A, Tervahartiala T, et al. Serum Mmp-8 and Timp-1 as Prognostic Biomarkers in Gastric Cancer. Tumour biology: the journal of the International Society for Oncodevelopmental Biology and Medicine. 2018; 40: 1010428318799266-66.
- Li X, Niu N, Sun J, Mou Y, He X, et al. Il35 Predicts Prognosis in Gastric Cancer and Is Associated with Angiogenesis by Altering Timp1, Pai1 and Igfbp1. Febs Open Bio. 2020; 10: 2687-2701.
- Shang W, Wang Y, Liang X, Li T, Shao W, et al. Setdb1 Promotes Gastric Carcinogenesis and Metastasis Via Upregulation of Ccnd1 and Mmp9 Expression. J Pathol. 2021; 253: 148-159.
- Zhu S, Shi J, Zhang S, Li Z. Klk6 Promotes Growth, Migration, and Invasion of Gastric Cancer Cells. J Gastric Cancer. 2018;18: 356- 367.
- Jyi A, Dmk A, Hp A, Mjk A, Dyk A, et al. Vgll1 Phosphorylation and Activation Promotes Gastric Cancer Malignancy Via Tgf-Β/ Erk/Rsk2 Signaling - Sciencedirect. Biochim Biophys Acta. 2020; 1868.
- Zhou Y, Cao G, Cai H, Huang H, Zhu X. The Effect and Clinical Significance of Fn1 Expression on Biological Functions of Gastric Cancer Cells. Cell Mol Biol. 2020; 66: 191-98.
- Bogdanovic A, Despotovic J, Galun D, Bidzic N, Nikolic A, et al. Prognostic Significance of Cdh1, Fn1 and Vim for Early Recurrence in Patients with Colorectal Liver Metastasis after Liver Resection. Cancer Manag Res. 2021; 13163-71.
- Zhang H, Sun Z, Li Y, Fan D, Jiang H. Microrna-200c Binding to Fn1 Suppresses the Proliferation, Migration and Invasion of Gastric Cancer Cells. Biomed Pharmacother. 2017; 88285-88292.
- Lin C, He H, Liu H, Li R, Chen Y, et al. Tumour-Associated Macrophages-Derived Cxcl8 Determines Immune Evasion through Autonomous Pd-L1 Expression in Gastric Cancer. Gut. 2019; 68: 1764.
- Yamamoto Y, Kuroda K, Sera T, Sugimoto A, Kushiyama S, et al. The Clinicopathological Significance of the Cxcr2 Ligands, Cxcl1, Cxcl2, Cxcl3, Cxcl5, Cxcl6, Cxcl7, and Cxcl8 in Gastric Cancer. Anticancer Res. 2019; 39: 6645-6652.
- Bae WJ, Ahn JM, Byeon HE, Kim S, Lee D. Ptprd-InactivationInduced Cxcl8 Promotes Angiogenesis and Metastasis in Gastric Cancer and Is Inhibited by Metformin. J Exp Clin Cancer Res. 2019; 38.
- Derks S, De Klerk LK, Xu X, Fleitas T, Liu KX, et al. Characterizing Diversity in the Tumor-Immune Microenvironment of Distinct Subclasses of Gastroesophageal Adenocarcinomas. Ann Oncol. 2020; 31: 1011-1020.
- Choi W, Kim J, Park J, Lee D-H, Hwang D, et al. Yap/Taz Initiates Gastric Tumorigenesis Via Upregulation of Myc. Cancer Res. 2018; 78: 3306-3320.
- Xu T-P, Ma P, Wang W-Y, Shuai Y, Wang Y-F, et al. Klf5 and Myc Modulated Linc00346 Contributes to Gastric Cancer Progression through Acting as a Competing Endogeous Rna and Indicates Poor Outcome. Cell Death Differ. 2019; 26: 2179-2193.
- Song S-Z, Lin S, Liu J-N, Zhang M-B, Du Y-T, et al. Targeting of Spp1 by Microrna-340 Inhibits Gastric Cancer Cell EpithelialMesenchymal Transition through Inhibition of the Pi3k/Akt Signaling Pathway. J Cell Physiol. 2019; 234: 18587-18601.
- Raja UM, Gopal G, Shirley S, Ramakrishnan AS, Rajkumar T. Immunohistochemical Expression and Localization of Cytokines/ Chemokines/Growth Factors in Gastric Cancer. Cytokine. 2017; 8982-8990.
- Lin X-M, Li S, Zhou C, Li R-Z, Wang H, et al. Cisplatin Induces Chemoresistance through the Ptgs2-Mediated Anti-Apoptosis in Gastric Cancer. Int J Biochem Cell Biol. 2019; 116.
- Han H, Lim J W, Kim H. Lycopene Inhibits Activation of Epidermal Growth Factor Receptor and Expression of Cyclooxygenase-2 in Gastric Cancer Cells. Nutrients. 2019; 11.
- Qi Y-F, Liu M, Zhang Y, Liu W, Xiao H, Luo B. Ebv Down-Regulates Cox-2 Expression Via Traf2 and Erk Signal Pathway in Ebv-Associated Gastric Cancer. Virus Res. 2019; 272.