
Japanese Journal of Gastroenterology Research
Research Article - Open Access, Volume 1
Prevalence and risk factors of non-alcoholic fatty liver disease (NAFLD) among Benha university employees
Reda Albadawy1; Ahmad Farid2; Awad Al Abed1; Eman Albittar4; Hanna Helal4; Ala Kandil1; Amer selim1; Abeer Elbahy1*
1 Department of Gastroenterology, Hepatology and Infectious Diseases, Banha University, Egypt.
2 Department of Radiology, Banha University, Egypt.
3 Department of Biochemistry, Banha University, Egypt.
4 Department of Epidemiology, Banha University, Egypt.
*Corresponding Author : Abeer Albahey
Gastroenterology, Hepatology and Infectious
Diseases, Banha University, Egypt.
Email: ab_elbahy@yahoo.com
Received : Nov 07, 2021
Accepted : Dec 20, 2021
Published : Dec 24, 2021
Archived : www.jjgastro.com
Copyright : © Albahey A (2021).
Abstract
Background: Non-Alcoholic Fatty Liver Disease (NAFLD) is one of the most frequent causes of chronic liver diseases all over the world. It’s not only confined to liver-related morbidity and mortality, but there is growing evidence that NAFLD is a multisystem disease.
Aims of the work: To estimate prevalence, risk factors and complications of NAFLD among Benha University employees.
Subjects and methods: Study was conducted on 165 employees working at Benha University during the period from September 2018 to March 2019. All participants were assessed by, full history taking, clinical examination, abdominal ultrasound (U/S) for diagnosis and grading of fatty liver Blood samples were collected for evaluation of complete blood count, liver and kidney functions, lipid profile, blood sugar, insulin level, and homeostasis model assessment estimate of insulin resistance (HOMA-IR).
Results: NAFLD was detected in 56.4% of participants. It was more in urban, elder and obese subjects. NAFLD-patients had higher frequency of Diabetes, hypertension, hypothyroidism and fatty pancreas than NAFLD-free subjects.
Conclusion: The high prevalence of NAFLD among Benha University employees was linked to old age, obesity and endocrinal disorders. NAFLD is associated with systematic disorders such as fatty pancreas with impaired glucose metabolism, and atherosclerosis with potential cardiac affection.
Keywords: non-alcoholic fatty liver disease (NAFLD); homeostasis model assessment estimate of insulin resistance (HOMA-IR).
Citation: Albadawy R, Farid A, Abed AA, Albittar E, Helal H, et al. Prevalence and risk factors of non-alcoholic fatty liver disease (NAFLD) among Benha university employees. Japanese J Gastroenterol Res. 2021; 1(10): 1046.
Introduction
NAFLD is a frequent cause of chronic liver disease (CLD) all over the world and will become the leading cause of end-stage liver disease [1]. It comprises a broad spectrum of disorders ranging from simple steatosis to steatohepatitis, fibrosis, cirrhosis [2] and also Hepatocellular Carcinoma (HCC) [3].
Globally, the prevalence of NAFLD is around 25-35% and affects large different proportions of men and women [4]. A wide variation in the NAFLD prevalence was related to the presence of certain risk factors. Steatosis was detected in 70% of obese subjects compared to 35% in the non-obese. In addition, the prevalence of Non-Alcoholic Steatohepatitis (NASH) was 18.5% and 3% among obese and non-obese subjects respectively [5].
NAFLD is a systematic disease, which affects extrahepatic organs and regulatory pathways [6]. In the past 10 years, it has been identified that NAFLD-related chronic diseases include CLD, cardiovascular disease (CVD), and type 2 diabetes mellitus (T2DM). A metaanalysis revealed that NAFLD increased mortality by 57% primarily due to causes related to liver and cardiovascular disease and increased the risk of incident T2DM by approximately two-fold [7]. Another meta-analysis showed that NAFLD was associated with an approximately two-fold increase in the risk of chronic kidney disease (CKD) [8]. New evidence is also emerging that NAFLD is associated with other chronic diseases such as sleep apnea, colorectal cancer, osteoporosis, psoriasis and various endocrinopathies such as polycystic ovary syndrome [9]. The diagnosis of NAFLD is based on radiological imaging techniques. It was defined as the presence of more than 5% liver fat accumulation in the absence of other known causes of fatty liver such as alcohol, viral infection, drugs and autoimmunity [10]. Fatty acid binding proteins (FABPs) are a group of 15 kDa proteins, there are nine different members, which have been detected in different body tissues [11]. In liver cells, low molecular weight L-FABP is located and can easily reach circulation on minimal cellular damage. This helped by lack of interstitial barriers between liver cells and the blood, and its small molecular weight. Thus, L-FABP was considered a biomarker for early diagnosis of cellular damage [12]. This study aimed to assess the prevalence and risk factors of NAFLD among Benha University employees, and to identify potential risk factors related to it.
Subjects and methods
This cross-sectional study was conducted on employees working in Benha University Hospitals, Qalubeyia Governorate, Egypt. The study population comprised both male and female employees (20 to 60 years old) with no history of viral hepatitis and autoimmune-liver diseases. The field work was carried out from September 2018 to March 2019.
Ethical consideration
This study was approved by the Research Ethics Committee in Benha Faculty of Medicine. An informed consent was obtained from all participants. It included all details about the study (title, objectives, methods, expected benefits and risks, and confidentiality of data).
Subjects: The sample size for the study was calculated according to the following equation [13]:
Sample size =
Where
Z 1-α/2 = standard normal deviate; (at 5% type I error (P<0.05) it is 1.96).
P = expected proportion in population based on previous studies. d= absolute error or precision (0.05).
The total number of the study participants was 165 subjects, who conformed with the inclusion criteria and agreed to participate in the study. These were selected by the systematic random sampling technique.
Data collection tools
An arranged interview with every study participant was carried out at the Hepatology and Gastrointestinal Department in Benha University Hospital. All the study participants were exposed to full history taking and clinical examination including blood pressure and body mass index calculation by weight (kg)/ height (m)2.
Viral hepatitis including {hepatitis C virus (HCV), hepatitis B virus (HBV) infection as well as autoimmune and metabolic liver diseases} were excluded by* the investigations.
Sample collection: Venous blood samples after fasting for 10 hours were collected for evaluation of complete blood counting, liver profile including alanine aminotransferase (ALT), aspartate aminotransferase (AST), γ- glutamyltransferase (GGT), Alkaline Phosphatase and albumin, kidney functions tests including s. urea and s. creatinine, lipid profile including cholesterol, high density lipoprotein (HDL), low density lipoprotein (LDL), very low density lipoprotein (VLDL) and triglyceride (TG), fasting blood glucose, fasting insulin, and Homeostasis Model Assessment estimate of Insulin Resistance (HOMA-IR) test. HOMA-IR was assessed using the given mathematical equation [14].
HOMA-IR = fasting insulin (mU/ml) x fasting plasma glucose (mmol/l)/22.5.
All participants had abdominal ultrasound examinations by the same radiologist. Ultrasound grading of NAFLD severity was as follows: grade 1 (mild), defined as a slight diffuse increase in liver echogenicity in the liver parenchyma with normal visualization of the diaphragm and portal vein; grade 2 (moderate), defined as a moderately diffuse increase in liver echogenicity with slightly impaired visualization of the diaphragm and portal vein; and grade 3 (severe), defined as a marked increase in liver echogenicity with poor visualization of the diaphragm and portal vein [19].
The study participants were divided into two groups according to U/S findings as follows: Group I: including 93 patients with NAFLD. Group II: including 72 subjects without NAFLD
Statistical analysis
The collected data were summarized in terms of mean ± Standard Deviation (SD) and range for quantitative data and frequency and percentage for qualitative data. Comparisons between the different study groups were carried out using the Chi-square test (X2) and the Fisher Exact test (FET) to compare proportions as appropriate. The Student t-test (t) and the Mann-Whitney test (MW) were used to compare two groups of quantitative data regarding parametric and non-parametric data, respectively. Statistical significance was accepted at P value <0.05. The statistical analysis was conducted using STATA/SE version 11.2 for Windows (STATA corporation, College Station, Texas.
Results
This study was conducted on 165 subjects from employees working at Benha University Hospitals, Qalubeyia Governorate, Egypt. The prevalence of NAFLD in the studied subjects was 56.4% (93 out of 165). Table 1 shows comparisons between NAFLD patients (Group I) and subjects without NAFLD (Group II) regarding their demographic and clinical characteristics. NAFLD patients were more likely elder than subjects without NAFLD (45.13 ± 9.69 vs. 39.62 ± 10.85; P=0.0008). The majority of Group II (70.17%) were from rural areas (P<0.001). DM (P<0.001), hypertension (P<0.001) and hypothyroidism (P=0.036) were more frequent in Group I. Subjects with NAFLD had higher mean BMI than those without (31.58 ± 5.51 vs.28.84 ± 4.25; P=0.0007).
Regarding laboratory data of the studied groups (Table 2), NAFLD group had higher haemoglobin (Hb) level (P=0.005) and lower platelet count (P=0.02) compared to Group II. GGT, triglycerides and VLDL levels were significantly higher in NAFLD patients than NAFLD-free subjects at P<0.001.
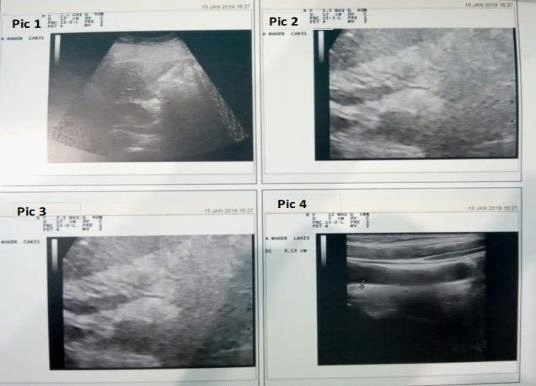
Table 1: Demographic and clinical data of the studied groups.
Variabl |
Group I |
Group II |
Total (no.=165) |
Test |
P |
||||
No |
% |
No |
% |
No |
% |
||||
Sex |
Female |
66 |
70.97 |
48 |
66.67 |
114 |
69.09 |
X2=0.35 |
0.55 |
Male |
27 |
29.03 |
24 |
33.33 |
51 |
30.91 |
|||
Age (years) |
Mean ± SD; (range) |
45.13±9.69; (2860) |
39.62±10.85; (2457) |
42.73±10.54; (24-60) |
t= 3.43 |
0.0008 |
|||
Residence |
Rural |
45 |
48.39 |
57 |
70.17 |
102 |
61.82 |
X2=16.29 |
<0.001 |
Urban |
48 |
51.61 |
15 |
20.83 |
63 |
38.18 |
|||
Special habits of medical importance |
No special habits |
78 |
83.87 |
54 |
75.0 |
132 |
80.0 |
FET |
0.25 |
Smoking |
12 |
12.90 |
12 |
16.67 |
24 |
14.55 |
|||
Contraceptive |
3 |
3.23 |
6 |
8.33 |
9 |
5.45 |
|||
DM |
No |
75 |
80.65 |
72 |
100.0 |
147 |
89.09 |
X2=15.64 |
<0.001 |
Yes |
18 |
19.35 |
0 |
0.00 |
18 |
10.91 |
|||
Hypertension |
No |
69 |
74.19 |
69 |
95.83 |
138 |
83.64 |
X2=13.88 |
<0.001 |
Yes |
24 |
25.81 |
3 |
4.17 |
27 |
16.36 |
|||
Endocrinal diseases(hypothyroid) |
No |
87 |
93.55 |
72 |
100.0 |
159 |
96.36 |
FET |
0.036 |
Yes |
6 |
6.45 |
0 |
0.0 |
6 |
3.64 |
|||
Weight (kg) |
Mean ± SD; (range) |
87.87±13.40; (55117) |
78.5±11.18; (57100) |
83.78±13.29; (55-117) |
t=4.78 |
<0.001 |
|||
Height (cm) |
Mean ± SD; (range) |
167.35±9.32; (150-186) |
165.25±7.61; (150-188) |
166.44±8.65; (150-188) |
t= 1.55 |
0.12 |
|||
BMI (kg/m2) |
Mean ± SD; (range) |
31.58±5.51; (19- |
28.84±4.25;(22.5- |
30.38±5.17; (19-45.3) |
t=3.48 |
0.0007 |
|||
P: Probability; SD: Standard Deviation; X2: Chi-Square Test; FET: Fisher Exact Test; T: Student T-Test; DM: Diabetes Mellitus; BMI: Body Mass Index.
Table 2: Laboratory data of the studied groups.
Variable |
Group I patients with |
Group II |
Total (no.=165) |
Test |
P |
||
Mean ± SD; (range) |
107.58±54.77; (62290) |
90.29±9.87; (72-115) |
100.04±42.41; (62-290) |
MW=0.31 |
0.76 |
||
Mean ± SD; (range) |
4.61±0.87; (1.82-6) |
4.57±0.60; (3.15-6) |
4.59±0.76; (1.82-6) |
MW=0.93 |
0.35 |
||
Mean ± SD; (range) |
1.21±0.61; (0.4-3.2) |
1.02±0.19; (0.6- |
1.13±0.48; (0.4-3.2) |
MW=1.21 |
0.23 |
||
Mean ± SD; (range) |
13.44±1.36; (11-16.7) |
12.72±1.89; (8.7-16.5) |
13.13±1.65; (8.7-16.7) |
t=2.88 |
0.005 |
||
Mean ± SD; (range) |
236±77.60; (137-423) |
263.75±76.97; (120-504) |
248.11±78.31; (120-504) |
t=2.29 |
0.02 |
||
Mean ± SD; (range) |
0.89±0.20; (0.6-1.6) |
0.89±0.17; (0.7- |
0.89±0.19; (0.6-1.6) |
MW=0.20 |
0.84 |
||
Mean ± SD; (range) |
28.22±7.98; (14-46) |
27.83±9.22; (14-44) |
28.05±8.52; (14-46) |
MW=0.53 |
0.59 |
||
Mean ± SD; (range) |
17.93±7.55; (9-40) |
17.17±5.72; (10-29) |
17.6±6.80; (940) |
MW=0.18 |
0.86 |
||
Mean ± SD; (range) |
24±6.12; (13-39) |
22.42±6.78; (12-38) |
23.31±6.44; (12-39) |
t=1.57 |
0.12 |
||
Mean ± SD; (range) |
0.53±0.15; (0.3-0.9) |
0.54±0.22; (0.21) |
0.54±0.18; (0.2-1) |
t=0.32 |
0.74 |
||
Mean ± SD; (range) |
4.93±0.17; (4.33-5) |
4.86±0.25; (4.05-5) |
4.90±0.21; (4.05-5) |
MW=1.61 |
0.11 |
||
Mean ± SD; (range) |
22.13±7.94; (7-39) |
16.75±13.91; (5-66) |
19.78±11.24; (5-66) |
MW=6.14 |
<0.001 |
||
Mean ± SD; (range) |
181.52±47.99; (112305) |
182.79±52.79; (97-281) |
182.07±49.99; (97-305) |
t=0.16 |
0.87 |
||
Mean ± SD; (range) |
141.9±82.85; (50337) |
100±47.09; (52247) |
123.62±72.42; (50-337) |
MW=3.37 |
0.0007 |
||
Mean ± SD; (range) |
28.39±16.56; (10- |
19.99±9.41; (10.4-49.4) |
24.72±14.48; (10-67.4) |
MW=3.37 |
0.0007 |
||
P: Probability; SD: Standard Deviation; x2; t: Student t-test; MW: Mann-Whitney test; HB: haemoglobin level; GGT, γ- glutamyl transferase; AST, aspartate aminotransferase; ALT, alanine aminotransferase; HOMA-IR, homeostasis model assessment estimate of insulin resistance; VLDL: very low density lipoprotein.
Table 3: Relations between US liver and HOMA-IR in NAFLD.
Variables |
Liver US Mean ±SD; (range) |
|
Test |
P |
|
Grade I (no.=18) |
Grade II |
Grade III |
|||
HOMA-IR |
1.02±0.34; (0.6-1.6) |
1.04±0.26; (0.4- |
1.59±0.89; (0.7- |
KW=4.58 |
0.10 |
P: Probability; SD: Standard Deviation; KW: Kruskal Wallis test, F: One-Way Analysis Of Variance (ANOVA); FET: Fisher Exact Test; a: significant difference compared to Normal; b: significant difference compared to Grade I; c: significant difference compared to Grade II; US: ultrasound; HOMA-IR, homeostasis model assessment estimate of insulin resistance.
Discussion
NAFLD is one of the most common causes of chronic liver disease in the world [20]. The prevalence of NAFLD in different populations varies widely ranging from 4% to 47% [21]. NAFLD comprises a broad spectrum of diseases; some patients may develop cirrhosis and hepatocellular carcinoma (HCC) [22]. Many NAFLD patients with the possibility of progressive liver disease represent a challenge for screening because NASH diagnosis requires invasive liver biopsy [20]. In addition, NAFLD potentially increases the burden of chronic extrahepatic diseases [23]. It has been found that NAFLD predisposes to T2DM. Moreover, it predisposes to the development and progression of cardiovascular diseases (CVD) such as left ventricular hypertrophy and dysfunction, atrial fibrillation and calcification of the heart valve, and chronic kidney disease (CKD) [10].
This study aimed to assess the prevalence of NAFLD and its complications among employees of Benha University
In the present study, the prevalence of NAFLD, was about 56%, this result was slightly less than [11], who documented that the prevalence of NAFLD was 66.6% (179 out of 268). This difference in result may be due to difference in ethnicity as their study was in Taiwan and all their patients were diabetic [19].
Regarding sex (table 1), NAFLD was more in females (70.96%) in the current study. This result was agreed with [21] who stated that (65%) of NAFLD patients were females [26]. In this study, there were statistically significant difference between NAFLD and nonNAFLD groups regarding, age, weight and BMI and the highest levels were in NAFLD group (table 1), The mean age of NAFLD patients was 45.13 ± 9.69 years while in subjects without NAFLD was 39.62 ± 10.85 years (p=0.0008). Correspondingly, [22] reported significantly higher BMI among NAFLD group than the non-NAFLD (28.76 ± 4.3 vs. 23.72 ± 3.04; P<0.01) however, there was non-significant difference between the two groups regarding age [27]. In the current study, the proportion of NAFLD patients from urban areas was higher than NAFLDfree subjects (51.61% vs. 20.83%) (table 1). That in agree with the results,of [22] whom found that the prevalence of NAFLD was higher in subjects from urban areas than in rural subjects (n = 45, 64.29% vs. n = 25, 35.71%) [27]. In the present study, 19.35% of NAFLD patients had diabetes mellitus, while none of the non-NAFLD subjects was diabetic (table 1). Correspondingly, [23] documented that, DM was found in (28.33%) of NAFLD patients [28]. This may be explained by the risk of Type 2 DM increases by 5-fold in NAFLD patients as a result of insulin resistance in hepatic, muscle, and adipose tissue [24,29] and that the risk of developing Type 2 DM can be modified with improvement in NAFLD [25,30].
In the present study, there was statistically significant difference between NAFLD and non-NAFLD groups as regard the presence of HTN (table 1) and it was more in NAFLD group (P =< 0.001) and this was agreed with [25] who stated that there was a statistically significant difference between hepatic steatosis and non-steatosis groups as regard HTN and also it was more in steatosis group ( P=< 0.001) [31]. In addition, [26] found that CVDs were more likely in patients with NAFLD and recommended routine screening of all NAFLD patients for early diagnosis and proper intervention of CVDs to prevent progression and improve outcome [32]. The results of the current study revealed that liver enzymes (AST and ALT) (table 2) were higher in NAFLD group than in non-NAFLD group without significant difference between both groups. This may come in agreement with [27] who stated that, serum biomarkers and scores can also be alternative for diagnosis of steatosis with a 2- to 4-fold elevation of serum ALT and AST levels [33]. However, [28] stated that, it can be normal in 78% of the patients [34]. This may be explained by [29] who stated that oxidative stress and lipotoxicity may occur following hepatic steatosis, with further damage resulting from gut endotoxin and cytokines. Kupffer cells are the main process regulators that detect and respond to danger signals from hepatocytes, regulate steatosis, recruit inflammatory cells, and signal stellate cell survival [35].
Regarding the laboratory data of the studied groups, there were statistically significant differences between NAFLD and non-NAFLD groups as regard GGT (P = 0.001) and TG (P = 0.0007) levels and the highest level was in NAFLD group (table 2). These differences were also reported by [11], who found significant differences between NAFLD and non-NAFLD groups as regard GGT (P = 0.0001) and TG (P = 0.0001) levels and the highest level was in NAFLD group [19].
Conclusions
The prevalence of NAFLD among Benha University employees was 56%. NAFLD associated with elder age, obesity and endocrinal disorders. NAFLD is associated with systematic disorders such as fatty pancreas with impaired glucose metabolism, and atherosclerosis with potential cardiac affection.
Acknowledgments: The authors would like to acknowledge and thank Scientific Research fund, Benha University, Egypt for providing funds to complete this study.
References
- Younossi ZM, Anstee QM, Marietti M, Hardy T, Henry T, Eslam M, et al. Global Burden of NAFLD and NASH: Trends, Predictions, Risk Factors and Prevention. Nature Reviews Gastroenterology & Hepatology. 2018; 15: 11-20.
- McPherson S, Hardy T, Henderson E, Burt AD, Day CP and Anstee QM: Evidence of NAFLD Progression from Steatosis to FibrosingSteatohepatitis Using Paired Biopsies: Implications for Prognosis and Clinical Management. Journal of Hepatology. 2015; 62: 1148-1155.
- Clark JM: The epidemiology of nonalcoholic fatty liver disease in adults. J ClinGastroenterol. 2006; 40: 5-10.
- Ahmed MH, Barakat S: Almobarak AO: Nonalcoholic fatty liver disease and cardiovascular disease: has the time come for cardiologists to be hepatologists? J Obes. 2012: 483135.
- Sanyal AJ: American Gastroenterological Association. AGA technical review on nonalcoholic fatty liver disease. Gastroenterology 2002; 123: 1705-25.
- Armstrong, M.J., Adams, L.A., Canbay, A., and Syn, W.K. Extrahepatic complications of nonalcoholic fatty liver disease. Hepatology. 2014; 59: 1174-1197.
- Musso G, Gambino R, Tabibian JH, Ekstedt M, Kechagias S, Hamaguchi M et al.: Association of non-alcoholic fatty liver disease with chronic kidney disease: a systematic review and metaanalysis. PLoS Med. 2014; 11: 1-31.
- Musso G, Cassader M, Olivetti C, Rosina F, Carbone G and Gambino R: Association of obstructive sleep apnoea with the presence and severity of non-alcoholic fatty liver disease. A systematic review and meta-analysis. Obes Rev. 2013; 14: 417-431
- Byrne CD, Targher G: NAFLD: A multisystem disease .Journal of Hepatology. 2015; 62: 47-64.
- . Glatz JF, van der Vusse GJ. Cellular fatty acid-binding proteins: Their function and physiological signification. Prog Lipid Res. 1996; 3: 243-282.
- Pelsers MM, Morovat A, Alexander GJ, Hermens W, Trull AK, Glatz JF, et al. Liver Fatty Acidbinding Protein as a Sensitive Serum Marker of Acute Hepatocellular Damage in Liver Transplant Recipients. Clin Chem. 2002; 48: 2055-2057
- Charan J and Biswas T.: How to calculate sample size for different study designs in medical research? Indian J Psychol Med. 2013; 35: 121-126.
- Sokuortti E, Zhou Y, Peltonen M, Bugianesi E, Clement K, Bonnefont-Rousselot D et al.: Use of HOMA-IR to diagnose non-alcoholic fatty liver disease: a populationbased and inter-laboratory study. Diabetologia. 2017; 60: 1873-1882.
- Furuhashi M and Hotamisligi GS: Fatty acid-binding proteins: role in metabolic diseases and potential as drug targets. Nature reviews drug discovery. 2008; 7: 489-503.
- Younossi ZM, Koenig AB, Abdelatif D, Fazel Y, Henry L and Wymer M: Global Epidemiology of Nonalcoholic Fatty Liver DiseaseMeta-Analytic Assessment of Prevalence, Incidence, and Outcomes. Hepatology. 2016; 64: 73-84.
- Kew MC: Obesity as a cause of hepatocellular carcinoma. Ann Hepatol. 2015; 14: 299–303.
- McPherson S, Hardy T, Henderson E, Burt AD, Day CP and Anstee QM: Evidence of NAFLD Progression from Steatosis to FibrosingSteatohepatitis Using Paired Biopsies: Implications for Prognosis and Clinical Management. Journal of Hepatology. 2015; 62: 1148-1155.
- Tsuneto A, Hida A, Sera N, Imaizumi M, Ichimaru S, Nakashima E, et al.: Fatty liver incidence and predictive variables. Hypertens Res. 2010; 33: 638-643.
- Haunerland NH and Spener F: Fatty Acid-Binding Proteins-Insights from Genetic Manipulations. Progress in Lipid Research. 2004; 43: 328-349.
- . Akbal E, Koçak E, Akyürek Ö, Köklü S, Batgi H and Şenes M: Liver fatty acidbindingprotein as a diagnostic marker for non-alcoholic fatty liver disease. Wien Klin Wochenschr. 2016; 128: 48-52.
- Gabali OSA : Study of Prevalence of Nonalcoholic Fatty Liver Disease in Type II Diabetes Mellitus Patients and Variations in Liver Enzymes and Lipid Profile in Diabetic Patients with Fatty Liver in Comparison With Patients Without Fatty Liver. Med. J. Cairo Univ. 2019; 87: 687-691.
- Abdulaziz B, Abdu S, Amin A, El Menyawi A, Ahmed A, Khalil M, et al. Assessment of Liver Fatty Acid Binding Protein (L-FABP) as a Diagnostic Marker in Non-Alcoholic Fatty Liver Disease. Open Journal of Gastroenterology. 2019; 9: 113124.
- Binobaid AO, Alalwan MA, Almalki AHA, Almaghrabi SKN , Sharif MKH , Alomair AAN. et al.: Prevalence and Risk Factors of Fatty Liver among Adults. The Egyptian Journal of Hospital Medicine. 2018; 70: 1552-1567.
- Jäger S, Jacobs S, Kröger J, Stefan N, Fritsche A, Weikert C, et al.:Association between the fatty liver index and risk of type 2 diabetes in the EPIC-potsdam study. PLoS One. 2015; 10: 1-14.
- Yamazaki H, Tsuboya T, Tsuji K, Dohke M and Maguchi H: Independent association between improvement of nonalcoholic fatty liver disease and reduced incidence of type 2 diabetes. Diabetes Care. 2015; 38: 1673-1679.
- Tana C, Ballestri S, Ricci F, Di Vincenzo A, Ticinesi A, Gallina S el al. Cardiovascular Risk in Non-Alcoholic Fatty Liver Disease: Mechanisms and Therapeutic Implications. International Journal of Environmental Research and Public Health. 2019; 16: 1-19.
- . Hazlehurst JM, Woods C, Marjot T, Cobbold JF, Tomlinson JW.: Non-alcoholic fatty liver disease and diabetes. Metabolism. 2016; 65: 1096-1108.
- Marchesini G, Day ChP, Dufour JF, Canbay A, Nobili V, Ratziu V et al.: EASLEASD-EASO clinical practice guidelines for the management of non-alcoholic fatty liver disease. J Hepatol. 2016; 64: 1388-1402.
- Duwaerts CC and Maher JJ: Mechanisms of Liver Injury in NonAlcoholic Steatohepatitis. Curr Hepatol Rep. 2014; 13: 119-129.