
Japanese Journal of Gastroenterology Research
Research Article - Open Access, Volume 1
Role of NRAS upregulation as diagnostic marker in cholangiocarcinoma
Zheng Kang1*; Guo Feifei2
1Department of Anesthesiology, Southeast University, Zhongda Hospital, Nanjing, China.
2Department of Obstetrics and Gynecology, Nanjing Drum Tower Hospital, Affiliated to Nanjing University Medical School, Nanjing, China.
*Corresponding Author: Zheng Kang
Department of Anesthesiology, Southeast University, Zhongda Hospital, Nanjing, China.
Tel: 0086-25-83269101;
Email: robertzheng@163.com
Received : Oct 27, 2021
Accepted : Nov 19, 2021
Published : Nov 26, 2021
Archived : www.jjgastro.com
Copyright : © Kang Z (2021).
Abstract
Background: Cholangiocarcinoma (CCA) is the second leading primary liver cancer. Lacking of accurate diagnostic markers in response to chemotherapeutic treatment in CCA is one of the significant challenges in CCA personalized therapy. Protein-coding gene Neuroblastoma RAS viral oncogene homolog (NRAS) is one of the most reported mutations and overexpressed genes in CCA. The correlation between the mRNA expression level of NRAS and CCA tumorigenesis is still not detailed discussed. Thus, we evaluated the diagnostic and prognostic values of NRAS in CCA.
Method: We downloaded transcriptional expression profiles from the Cancer Genome Atlas for pan-cancer analysis and further study between CCA and normal tissues. NRAS protein expression data were acquired from the Human Protein Atlas database. We employed the receiver operating characteristic (ROC) curve to assess the potential value of NRAS as a diagnostic marker. Kaplan-Meier method was performed to testify the NRAS on overall survival (OS). The STRING database was used to construct the protein-protein interaction networks. We also conducted functional enrichment analyses with the "Cluster Profiler" R package.
Results: Overexpression of NRAS mRNA was observed in various cancers in pan-cancer analysis, including CCA patients. Our further study showed that both mRNA and protein expression of NRAS was hugely increased in CCA tissue compared to adjacent normal tissue. The upregulated expression of NRAS was associated with the tumor metastasis stage. ROC curve analysis indicated that with a cutoff level of 4.39, the sensitivity, specificity, and accuracy for NRAS differentiate CCA from pericarcinomatous tissue were 0.972, 0.999, and 0.999, respectively. Kaplan-Meier survival analysis indicated that overexpression of NRAS doesn't affect the OS of CCA patients. Function enrichment analyses proposed some co-expressed genes of NRAS in CCA.
Conclusion: Overexpressed NRAS is strongly correlated with tumorigenesis of CCA. The present study suggests that NRAS can be potentially used as a diagnostic biomarker of CCA oncogenes.
Keywords: cholangiocarcinoma; NRAS; diagnostic biomarker; tumorigenesis; metastatic stage.
Abbreviations: BLCA: Bladder Urothelial Carcinoma; BRAF: Proto-Oncogene B-Raf; BRCA: Breast Invasive Carcinoma; CHOL: Cholangiocarcinoma; COAD: Colon Adenocarcinoma; ESCA: Esophageal Carcinoma; EGFR: Epidermal Growth Factor Receptor; GBM: Glioblastoma Mutiforme; GO Analyses: Gene Ontology Analyses; HNSC: Head And Neck Squamous Cell Carcinoma; HPA: Human Protein Atlas; KEGG: Kyoto Encyclopedia Of Genes And Genomes; KICH: Kidney Chromophobe; KIRC: Kidney Renal Clear Cell Carcinoma; KIRP: Kidney Renal Papillary Cell Carcinoma; LIHC: Liver Hepatocellular Carcinoma; LUAD: Lung Adenocarcinoma; LUSC: Lung Squamous Cell Carcinoma; MAPK: Mitogen-Activated Protein Kinase; MMPK3: Matrix Metallopeptidase 3; NF1: Neurofibromin 1; OS: Overall Survival; PIK3CA: Phosphatidylinositol-4,5-Bisphosphate 3-Kinase Catalytic Subunit Alpha; PRAD: Prostate Adenocarcinoma; READ: Rectum Adenocarcinoma; STAD: Stomach Adenocarcinoma; TCGA: The Cancer Genome Atlas; THCA: Thyroid Carcinoma; UCEC: Uterine Corpus Endometrial Carcinoma.
Citation: Kang Z, Feifei G. Role of NRAS upregulation as diagnostic marker in cholangiocarcinoma. Japanese J Gastroenterol Res. 2021; 1(8): 1038.
Introduction
Cholangiocarcinoma (CCA), or bile duct carcinoma, is a malignancy that originates cholangiocytes and other cells along the biliary tree [1]. Following hepatocellular carcinoma, CCA is the second most common primary liver cancer, it comprising approximately 10-20% of all primary hepatic tumors and 3% of all gastrointestinal cancers, around 139,000 patients die of CCA each year worldwide [2], and exhibits relative higher mortality in specific Asian regions, such as South Korea, Thailand, and China [3]. Although progress in CCA awareness, knowledge, diagnosis, and therapies have been made in the past decade, patient prognosis and 5-year survival are still disillusionary [3]. The poor prognostic of CCA is partly due to the difficulty in early diagnosing and lacking an effective chemotherapeutic strategy. Therefore, searching for a novel biomarker for early and therapeutic-goal-directed diagnosis of CCA is urgently needed.
Neuroblastoma RAS viral oncogene homolog (NRAS) is a well-known oncogene, which exhibits protumoral character in various cancers [4]. It encodes NRAS protein, is one subtype of Ras GTPase superfamily, the monomeric GTP-binding and hydrolyzing (GTPases) proteins that act as GDP-/GTP-regulated, molecular switches in transducing extracellular cues into intracellular signals, which regulates diverse fundamental cellular processes, including cell proliferation and differentiation, maintenance of cell morphology, migration, survival, apoptosis, among others [5]. As a notable oncogene, NRAS mutations or overexpression were found in most cancers, including CCA. Cells with NRAS mutations or upregulation lean-to malignant transformation and display malignant phenotypes [5]. Recently, increasing numbers of papers shed light on NRAS mutations or upregulation in bile duct disease. Nakagawa and colleagues reported that upregulated NRAS produced a massive amount of inflammatory cytokines and promoted PBC's progress [6]. Brindley and colleagues reviewed that NRAS is one of the most common mutation and/or overexpression sites in all types of CCA [1]. Meanwhile, as a well-studied oncogene, types of inhibitors aimed at blocking NRAS and NRAS/RAF/MAPK pathway were invented. Identifying patients with NRAS/RAF/MAPK-driven CCA is one essential step for personalized therapy. Therefore, NRAS has an excellent potential to be a diagnostic biomarker in CCA patients.
The predictive value of NRAS in CCA is still not thoroughly studied. Based on the mutation or overexpression of NRAS in CCA, we hypothesize that the expression level of NRAS is associated with the tumorigenesis of CCA. To testify the hypothesis, we analyzed data from The Cancer Genome Atlas (TCGA). We confirmed that NRAS is upregulated in CCA. The following receiver operating characteristic (ROC) curve analysis showed considerably high sensitivity and specificity of NRAS in predicting CCA. The present study reveals the potential of NRAS as a CCA diagnosis biomarker.
Material and methods
TCGA datasets
We downloaded NRAS transcriptional expression data and corresponding clinical information from the official website of The Cancer Genome Atlas (TCGA) database (https://www.genome.gov/Funded-Programs-Projects/Cancer-Genome-Atlas). This study included 17 different types of cancer, and the related pericarcinomatous sample groups contained at least 5 as control, respectively.
RNA-sequencing data of NRAS in CCA
NRAS RNA-sequencing Dataset in CCA was downloaded from TCGA. We recruited 36 CCA samples and 9 adjacent normal tissue. The dataset includes NRAS gene expression data and clinical information, age, TNM stage information, and other features. The mRNA expression data were displayed as mean ± SD.
The human protein atlas (HPA)
As a human proteome program, HPA aims to map all the human proteins in cells, tissues and organs using an integration of various omics technologies. We compared the protein expression of NRAS between normal tissue and CCA.
OS analysis
Prognostic data was obtained from a paper published in 2018 by Liu and colleagues (7). RNAseq data were downloaded from the TCGA CHOL level 3 program in an HTSeq-FPKM form. We conducted the Kaplan-Meier product limit method for describing the OS. The log-rank test was applied to estimate the differences between patient groups and the Cox models to assess the multivariable relationships between patient characteristics and OS [8]. The R package survminer was conducted for the final visualization.
Protein-Protein Interaction (PPI) networks and Functional Enrichment Analysis
STRING (Version: 11.5) provides sample data on protein-protein interactions. In STRING, "scores" were used to annotate the interaction between different proteins. In this study, co-expression genes were searched and created PPI networks with a score>0.4. We performed gene ontology (GO) enrichment and Kyoto Encyclopedia of Genes and Genome (KEGG) pathway analyses of co-expression genes with the R package Cluster Profiler. The visualization was conducted by the R package ggplot2.
Statistical analyses
All statistical analyses were performed with IBM SPSS statistic 23. We performed paired t-test and Mann-Whitney U-test to determine the differences between CCA tissues and adjacent normal tissues. ROC curve was created to study the cutoff value of NRAS. Kaplan-Meier and log-rank tests were conducted to assess the effect of NRAS on survival.
Results
Expression pattern of NRAS in pan-cancer analysis
For evaluating the pattern of NRAS mRNA expression across different cancer types, we chose 17 cancer types that contained at least five samples in the pericarcinomatous group. NRAS mRNA level was dramatically overexpressed in 11 of all 17 cancer types, down-regulated in kidney chromophobe and thyroid carcinoma. Those data indicated that abnormal mRNA expression of NRAS was across different types of carcinomas.
Elevated mRNA and protein expression of NRAS in CCA patients
For the purpose of exploring the mRNA and protein level of NRAS in CCA patients, we analyzed expression data from TCGA and HPA. Regarding mRNA expression, paired data analyses indicated that mRNA expression levels of NRAS in CCA tissues were substantially elevated compared to those in adjacent normal tissues (Figure 2A, n=9, 5.672 ± 0.425 vs. 3.824 ± 0.247, Paired-Samples T-Test, p<0.001). Unpaired analyses also showed that in the same pattern, samples from CCA tissue (n=36) showed significantly higher NRAS mRNA expression than control ones (n=9) (Figure 2B, 5.724 ± 0.637 vs 3.824 ± 0.247, Welch's t-test, P<0.001). For presenting the NRAS protein expression in a graphical way, immunohistochemical stainings from HPA were shown. The images indicated that NRAS protein was dramatically upregulated in CCA tissue (Figure D1, D2) compared to control ones (Figure C1, C2). The above results pointed that both mRNA and protein levels of NRAS are overexpressed in CCA tissues.
Correlation analysis between NRAS mRNA expression and clinical pathological characteristics of CCA patients
We conducted Mann-Whitney U-test and logistic regression analysis to evaluate the relationship between NRAS mRNA expression and CCA tissue pathological characteristics. Clinical characteristics in patients of CCA are listed in (Table1). NRAS mRNA expression was significantly higher in M0 tissue than in M1 ones (P=0.013), as shown in (Figure 3). Meanwhile, no statistically significant correlations were found between NRAS overexpression and other clinical pathological characteristics, such as T stage, M stage, gender, age, weight, histological type, fibrosis Ishak score, and CA19-9 level. Taken together, these results suggested that NRAS is related to the metastatic state. It hinted that NRAS might not correlate to the tumor progression rather than tumorigenesis.
RNA-Seq levels of NRAS as a diagnostic biomarker to distinguish CCA samples from normal samples
The ROC curve analysis was employed to study the diagnostic value of NRAS in CCA samples. The result showed that NRAS mRNA expression had an AUC value of 0.997 (95% CI: 0.988-1.000). At a cutoff of 4.39, sensitivity, specificity, and accuracy of NRAS were 0.972, 0.999, and 0.999, respectively. The positive predictive value was 90.0%, and the negative predictive value was 25.2%. These findings suggested that NRAS could be a potential prognostic biomarker for differentiating CCA tissues and normal ones in the clinical setting.
NRAS mRNA expression and OS
In order to learn the relationship between NRAS mRNA expression and OS in CCA patients, we performed the Kaplan-Meier curves analysis. As shown in Figure 4B, the expression of NRAS mRNA didn't affect the OS in CCA patients, and there were no significant OS differences between high NRAS mRNA expression patients and low ones (P=0.199).
Protein-Protein Interaction networks and functional annotations
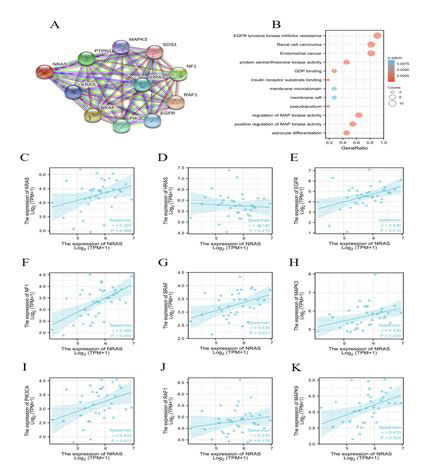
NRAS related data from the STRING database was checked with Gene Ontology (GO) analyses and the Kyoto Encyclopedia of Genes and Genomes (KEGG) pathway mapping. (Figure 5A) exhibited the network of NRAS and its top 10 co-expressed proteins. The following analysis and functional annotations showed that NRAS was associated with EGFR tyrosine kinase inhibitor resistance, protein serine/threonine kinase activity, GDP binding, membrane microdomain, positive regulation of MAPK activity astrocyte differentiation, and so on (Figure 5B). Figure 5C-K displayed the correlation between NRAS expression and co-expressed genes in TCGA CCA patient data.
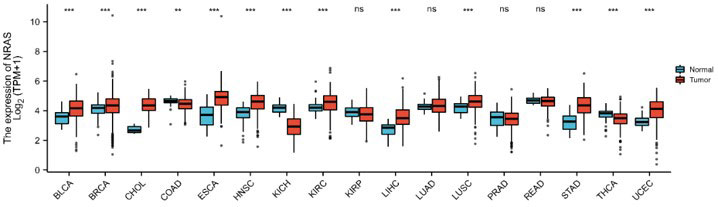
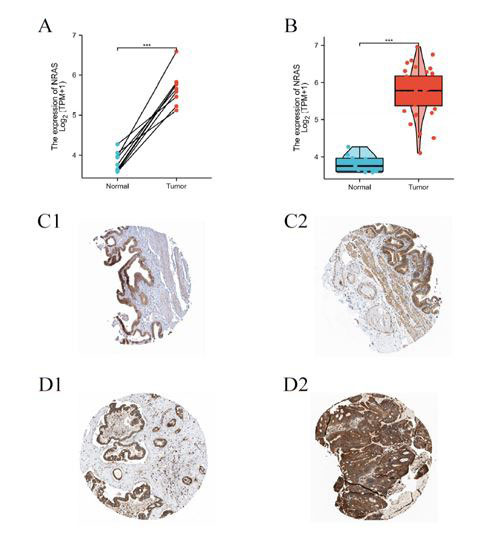
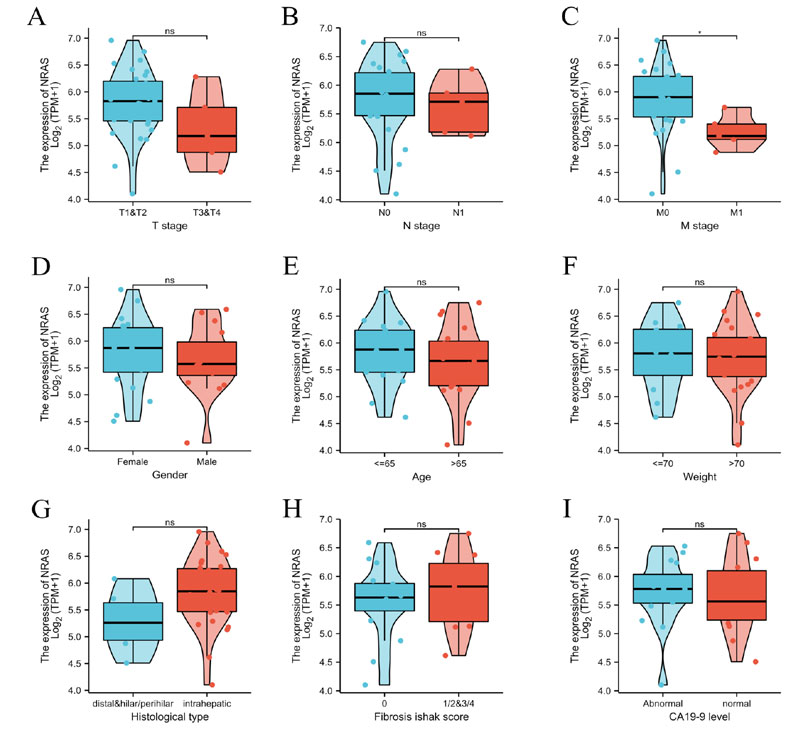
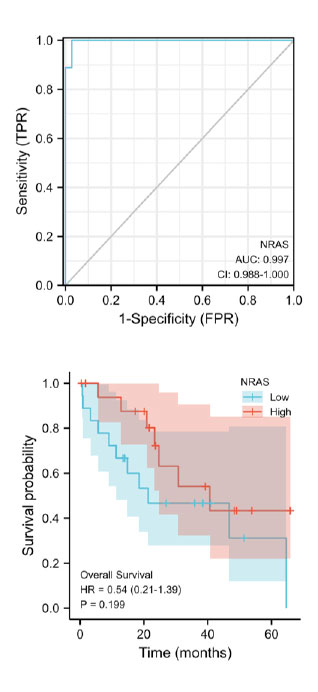
Table 1: Clinical characteristics of the cholangiocarcinoma patients based on TCGA database.
| Characteristic | Low expression of NRAS | High expression of NRAS | P |
|---|---|---|---|
| N | 18 | 18 | |
| T stage, n (%) | 0.436 | ||
| T1 | 9 (25%) | 10 (27.8%) | |
| T2 | 5 (13.9%) | 7 (19.4%) | |
| T3 | 4 (11.1%) | 1 (2.8%) | |
| T4 | 0 (0%) | 0 (0%) | |
| N stage, n (%) | 0.636 | ||
| N0 | 11 (35.5%) | 15 (48.4%) | |
| N1 | 3 (9.7%) | 2 (6.5%) | |
| M stage, n (%) | 0.013* | ||
| M0 | 10 (30.3%) | 18 (54.5%) | |
| M1 | 5 (15.2%) | 0 (0%) | |
| Age, meidan (IQR) | 68 (53.25, 71.75) | 63 (58.25, 71.75) | 0.669 |
Discussion
In the present work, we confirmed that the mRNA and protein expression of NRAS is upregulated in CCA tissues. The overexpressed NRAS mRNA is positively correlated with CCA diagnosis. ROC curve analysis suggested that NRAS could be a potential clinical biomarker to diagnose CCA tissue from normal ones. Our data also showed that NRAS mRNA expression is associated with the M0 stage but not the M1 stage. In summary, the expression level of NRAS may be a diagnostic biomarker of CCA.
NRAS is a critical member of the Ras superfamily. It is considered one of the vital regulators of cell proliferation, cell migration, cell death, and survival [5,9]. As a well-known oncogene, overexpressed NRAS stimulates downstream targets and urges tumor cells to become more aggressive phenotypes [4,10]. Furthermore, several pieces of research indicated that upregulation of NRAS in various cancers is associated with an unfavorable prognosis and shorter OS [11,12]. However, the upregulation of NRAS mRNA and its diagnosis value has not been systematically studied in CCA. In the present research, the pan-cancer analysis displayed that NRAS mRNA is abnormally expressed in various cancers. We furtherly testified that the expression of NRAS mRNA is meaningfully increased in CCA tissue. This data agrees with the previous report by Belikov and colleagues [13]. Our findings indicated that the expression level of NRAS might potentially be employed as a diagnostic biomarker for distinguishing CCA tissue from normal ones.
The characteristic of NRAS as a prognostic or diagnostic biomarker correlates with poor OS in various cancer. In melanoma patients, many studies revealed that NRAS is significantly correlated with aggressive phenotype and poor prognosis [14]. In leukemia, Cuiffo and colleagues reported that palmitoylation of oncogene NRAS positively associated with the leukemogenesis process, suggesting that blocking palmitoylation may be effective in treating oncogenic NRAS-associated malignancies [15]. One paper from Jakob revealed that mutation and amplification of NRAS are associated with shorter survival and poor prognosis in metastatic melanoma [12]. Meanwhile, therapies targeting NRAS or downstream genes have achieved a delightful response rate in melanoma patients [16]. However, the prognostic value of NRAS has not been estimated in CCA. Given that the overexpression of NRAS is strongly correlated with CCA tumorigenesis, we speculated NRAS might affect the OS in CCA patients. But the OS analysis in CCA patients showed no differences between patients with high and low NRAS mRNA levels. Thus, our analysis led us to conclude that NRAS mRNA expression is positively correlated to CCA tumorigenesis but not prognosis.
NRAS is a crucial component of the RAS/RAF/MAPK signaling pathway. The pathway plays an essential role in several malignant cancers. For instance, in melanoma, overexpression or mutation of NRAS recruits and stimulates bunches of different cancer-promoting signaling pathways that include the RAS/RAS/MAPK pathway, PI3k/AKT pathway, and many others [17,18]. In colorectal cancer, Takane and colleagues pointed out that low DNA methylation epigenotype is related to NRAS mutation and expression, further activating the RAF/MAPK signaling pathway [19]. In the present work, analyses of co-expression genes in CCA tissue showed that overexpression of NRAS is strongly correlated to that of EGFR, BRAF, MMPK3, MAPK, and PIK3CA. Based on our findings in this paper, we speculate that the upregulation of NRAS mRNA expression might also affect PI3K/AKT, fibrogenesis, and other signaling pathways in the setting of CCA. However, further intensive studies should be performed to confirm this correlation.
This study has several limitations. Firstly, the expression profiles of NRAS were downloaded from an online public database. Further study with CCA human samples for validating is necessary. Second, the sample size of clinical data is relatively small; more CCA patients should be included for a more convincing result.
Conclusion
In conclusion, our study confirmed that mRNA expression of NRAS is significantly increased in CCA tissue compared to pericarcinomatous tissue. The increment is correlated with the metastasis stage. This work suggests that NRAS could be regarded as a potential biomarker of CCA tumorigenesis to diagnose CCA patients from normal ones.
Declarations
Conflict of interest: The authors have no conflict of interest to declare. No financial support has been involved in this paper.
References
- Brindley PJ, Bachini M, Ilyas SI, Khan SA, Loukas A, Sirica AE, et al. Cholangiocarcinoma. Nat Rev Dis Primers. 2021; 7(1):65.
- Banales JM, Marin JJG, Lamarca A, Rodrigues PM, Khan SA, Roberts LR, et al. Cholangiocarcinoma 2020: the next horizon in mechanisms and management. Nat Rev Gastroenterol Hepatol. 2020; 17(9):557-88.
- Alsaleh M, Leftley Z, Barbera TA, Sithithaworn P, Khuntikeo N, Loilome W, et al. Cholangiocarcinoma: a guide for the nonspecialist. Int J Gen Med. 2019; 12:13-23.
- Goitre L, Trapani E, Trabalzini L, Retta SF. The Ras superfamily of small GTPases: the unlocked secrets. Methods in molecular biology (Clifton, NJ). 2014; 1120:1-18.
- Chen K, Zhang Y, Qian L, Wang P. Emerging strategies to target RAS signaling in human cancer therapy. J Hematol Oncol. 2021; 14(1):116.
- Nakagawa R, Muroyama R, Saeki C, Goto K, Kaise Y, Koike K, et al. miR-425 regulates inflammatory cytokine production in CD4+ T cells via N-Ras upregulation in primary biliary cholangitis. Journal of hepatology. 2017; 66(6):1223-30.
- Liu J, Lichtenberg T, Hoadley KA, Poisson LM, Lazar AJ, Cherniack AD, et al. An Integrated TCGA Pan-Cancer Clinical Data Resource to Drive High-Quality Survival Outcome Analytics. Cell. 2018; 173(2):400-16 e11.
- Hanrahan EO, Gonzalez-Angulo AM, Giordano SH, Rouzier R, Broglio KR, Hortobagyi GN, et al. Overall survival and cause-specific mortality of patients with stage T1a,bN0M0 breast carcinoma. J Clin Oncol. 2007; 25(31):4952-60.
- Degirmenci U, Wang M, Hu J. Targeting Aberrant RAS/RAF/MEK/ERK Signaling for Cancer Therapy. Cells. 2020; 9(1).
- Wennerberg K, Rossman KL, Der CJ. The Ras superfamily at a glance. J Cell Sci. 2005; 118(Pt 5):843-6.
- Foltran L, Maglio GD, Pella N, Ermacora P, Aprile G, Masiero E, et al. Prognostic role of KRAS, NRAS, BRAF and PIK3CA mutations in advanced colorectal cancer. Future Oncology. 2015; 11(4):629-40.
- Jakob JA, Bassett Jr RL, Ng CS, Curry JL, Joseph RW, Alvarado GC, et al. NRAS mutation status is an independent prognostic factor in metastatic melanoma. Cancer. 2012; 118(16):4014-23.
- Belikov AV, Otnyukov DV, Vyatkin AD, Leonov SV. Novel Driver Strength Index highlights important cancer genes in TCGA PanCanAtlas patients. medRxiv. 2021: 2021.08.01.21261447.
- Ellerhorst JA, Greene VR, Ekmekcioglu S, Warneke CL, Johnson MM, Cooke CP, et al. Clinical correlates of NRAS and BRAF mutations in primary human melanoma. Clinical cancer research : an official journal of the American Association for Cancer Research. 2011; 17(2):229-35.
- Cuiffo B, Ren R. Palmitoylation of oncogenic NRAS is essential for leukemogenesis. Blood. 2010; 115(17):3598-605.
- Sosman JA, Kittaneh M, Lolkema MPJK, Postow MA, Schwartz G, Franklin C, et al. A phase 1b/2 study of LEE011 in combination with binimetinib (MEK162) in patients with NRAS-mutant melanoma: Early encouraging clinical activity. 2014; 32(15_suppl):9009-.
- Muñoz-Couselo E, Adelantado EZ, Ortiz C, García JS, Perez-Garcia J. NRAS-mutant melanoma: current challenges and future prospect. Onco Targets Ther. 2017; 10:3941-7.
- Garcia-Alvarez A, Ortiz C, Muñoz-Couselo E. Current Perspectives and Novel Strategies of NRAS-Mutant Melanoma. Onco Targets Ther. 2021; 14:3709.
- Takane K, Akagi K, Fukuyo M, Yagi K, Takayama T, Kaneda A. DNA methylation epigenotype and clinical features of NRAS-mutation(+) colorectal cancer. Cancer Med. 2017; 6(5):1023-35.